The Gartley Pattern is one of the most popular harmonic patterns in technical analysis, helping traders identify potential reversal points in the market. Developed by Harold McKinley Gartley in the 1930s, this pattern is based on a combination of Fibonacci ratios to create price zones with a high probability of reversal.
In this article, Forex Bit will help you understand the Gartley Pattern, how to identify and draw it, as well as the most effective trading strategies.
What is the Gartley Pattern?
The Gartley Pattern is a price formation belonging to the Harmonic Pattern group, constructed based on five key points: X, A, B, C, and D. This pattern reflects market corrections before continuing the main trend.
There are two main types of Gartley Patterns:
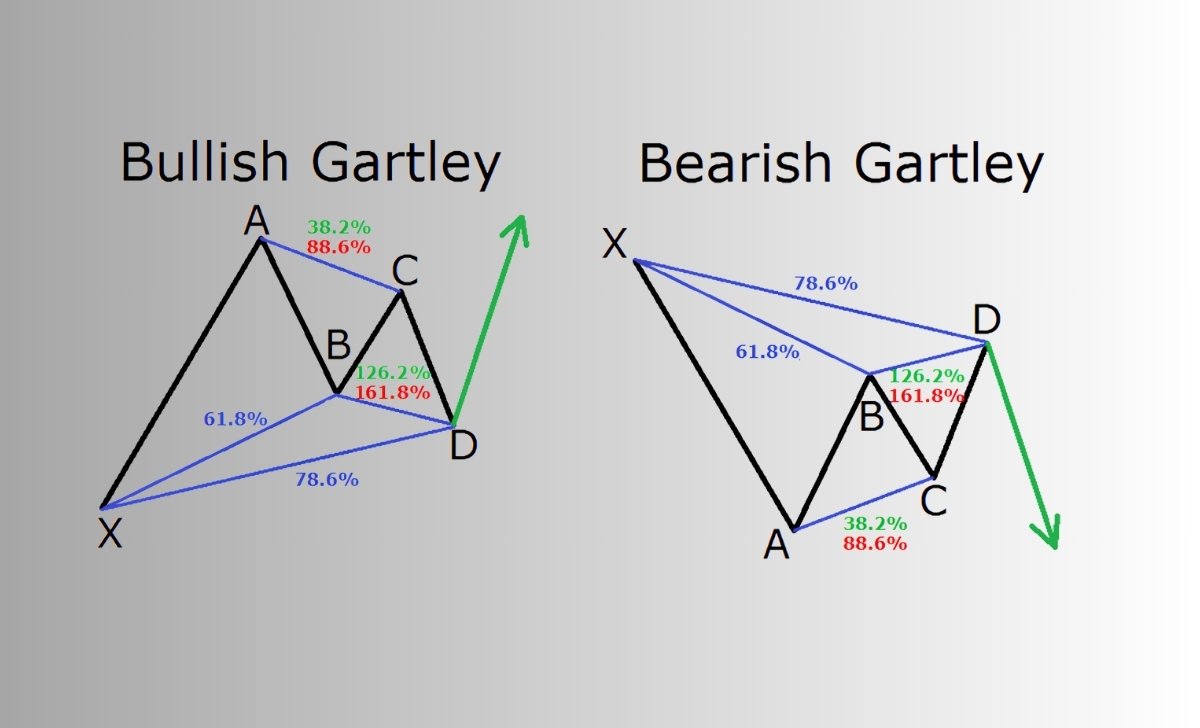
- Bullish Gartley: The main trend is bullish, with a temporary downward correction before continuing the uptrend.
- Bearish Gartley: The main trend is bearish, with a temporary upward correction before continuing the downtrend.
This pattern helps traders find optimal entry points based on Fibonacci confluence zones, reducing risk and increasing trading efficiency.
Structure of the Gartley Pattern
A standard Gartley Pattern must adhere to specific Fibonacci ratios:
- XA: The initial market trend.
- AB: A retracement from XA, typically retracing 61.8% Fibonacci of the XA leg.
- BC: A counter-move towards XA, ranging between 38.2% – 88.6% Fibonacci of the AB leg.
- CD: The final and most important leg, completing the pattern, typically extending 127.2% – 161.8% Fibonacci of the BC leg.
- D: The potential reversal point, aligning with the 78.6% Fibonacci retracement of the XA leg.
Comparison with other Harmonic Patterns
- This pattern is easier to identify than the ABCD Pattern and Butterfly Pattern.
- It has higher accuracy compared to traditional price patterns like Head & Shoulders or Double Top/Bottom.
How to identify and draw the Gartley Pattern on charts
To trade effectively with this pattern, you first need to know how to identify and accurately draw this pattern on charts.
Step 1: Identify the market trend
Before searching for a Gartley Pattern, determine the overall trend. If the market is in an uptrend, look for a Bullish Gartley; conversely, in a downtrend, look for a Bearish Gartley.
Step 2: Identify points X, A, B, C and D
Use the Fibonacci Retracement and Fibonacci Extension tools to measure the following points:
- XA: Identify the main market wave.
- AB: Check for 61.8% retracement of XA.
- BC: Identify a retracement between 38.2% and 88.6% of AB.
- CD: Use Fibonacci Extension of BC to find the 127.2% – 161.8% levels.
- D: The confluence point of the 78.6% Fibonacci retracement from XA and the 127.2% Fibonacci extension from BC.
Step 3: Check trading volume and supporting indicators
- Use RSI or Stochastic to check if the price is in an overbought/oversold zone.
- Observe MACD for divergence signals.
How to trade the Gartley Pattern effectively

Once you have identified the Gartley Pattern on the chart, you can trade it using the following steps:
- Identify Entry Points: If it is a Bullish Gartley, point D is the confluence zone of the 78.6% Fibonacci retracement from XA and the 127.2% Fibonacci Extension from BC, suitable for BUY entries. Conversely, for a Bearish Gartley, point D is the corresponding confluence zone for SELL entries.
- Set a Proper Stop Loss: For a Bullish Gartley, the Stop Loss should be placed 10-20 pips below point X to reduce risk. For a Bearish Gartley, the Stop Loss should be placed 10-20 pips above point X.
- Take Profit Effectively: The first Take Profit (TP1) target is usually at the 38.2% Fibonacci Retracement of the CD leg. If the price continues in the trend direction, the second Take Profit (TP2) can be placed at 61.8% Fibonacci level.
- Risk Management: Always use Stop Loss to protect capital and limit unexpected losses. Additionally, only enter trades when confirmed by other technical indicators like RSI and MACD.
Real-World examples of the Gartley Pattern

Example 1: Gartley Pattern in Forex
In the EUR/USD currency pair, a Bullish Gartley Pattern forms on the H4 timeframe:
- XA leg shows a strong increase.
- AB retraces to the 61.8% level.
- BC retraces slightly, around 50%.
- D aligns with the 78.6% Fibonacci retracement of XA.
Result: The price surges after touching point D, confirming a BUY entry signal.
Example 2: Gartley Pattern in the Crypto Market
On the BTC/USDT chart, a Bearish Gartley Pattern appears on the H1 timeframe:
- After a strong upward move (XA), the price retraces to the 61.8% level (AB).
- BC increases slightly, then CD extends to the 127.2% level of BC.
- When the price reaches point D, the RSI indicator signals overbought conditions.
Result: Bitcoin drops sharply after reaching D, confirming a SELL entry.
In summary, the Gartley Pattern is a powerful tool that helps traders accurately identify reversal points. However, it should be combined with other indicators to enhance trading effectiveness. If applied correctly with proper risk management, this pattern can become a valuable asset in your trading strategy!

As a Trading Coach with over 7 years of experience, I have guided both novice and experienced traders in mastering technical analysis and developing effective trading strategies. My personalized coaching approach has empowered many to enhance their skills and achieve consistent success in the forex market.
Email: [email protected]