The ABCD Pattern is a popular technical analysis model that helps identify price reversals in financial markets. By understanding the structure of this model, traders can predict trends and make more accurate trading decisions.
Let’s explore with Forex Bit the definition of the ABCD pattern, common types, and how to use it effectively in trading through the article below!
What is the ABCD Pattern?
The ABCD pattern is a price model used in technical analysis to predict price reversals in financial markets. This pattern often appears on price charts and helps traders identify potential trading opportunities, leading to more informed buy or sell decisions.
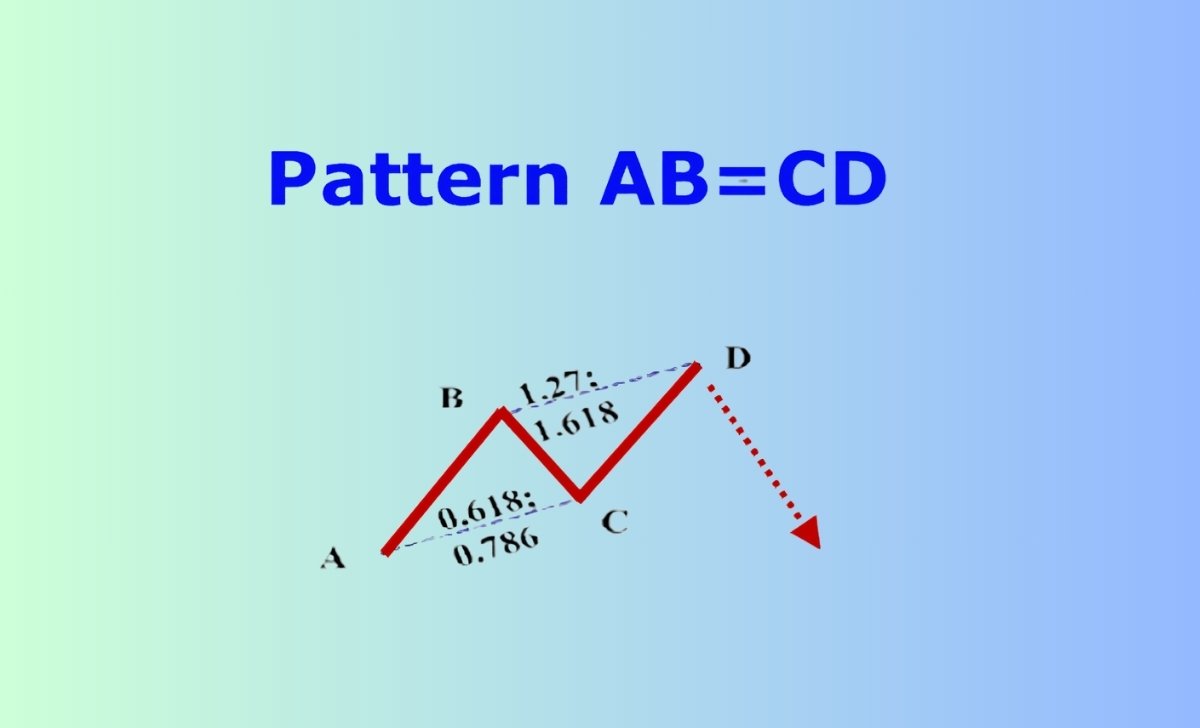
The pattern consists of four key points: A, B, C, and D, each playing an important role in determining the trend and price reversal.
- Point A is the starting point of the trend before model forms.
- Point B is the highest (or lowest) point in the first trend.
- Point C is the point where the price adjusts from B, which may be a retracement or temporary reversal.
- Point D is the confirmation point that completes the pattern and is the most crucial, where traders can make their trades.
This pattern can appear in two main forms: the bullish model and the bearish model. Accurately identifying points A, B, C, and D is key to applying this pattern in actual trading.
Common Types of ABCD Patterns
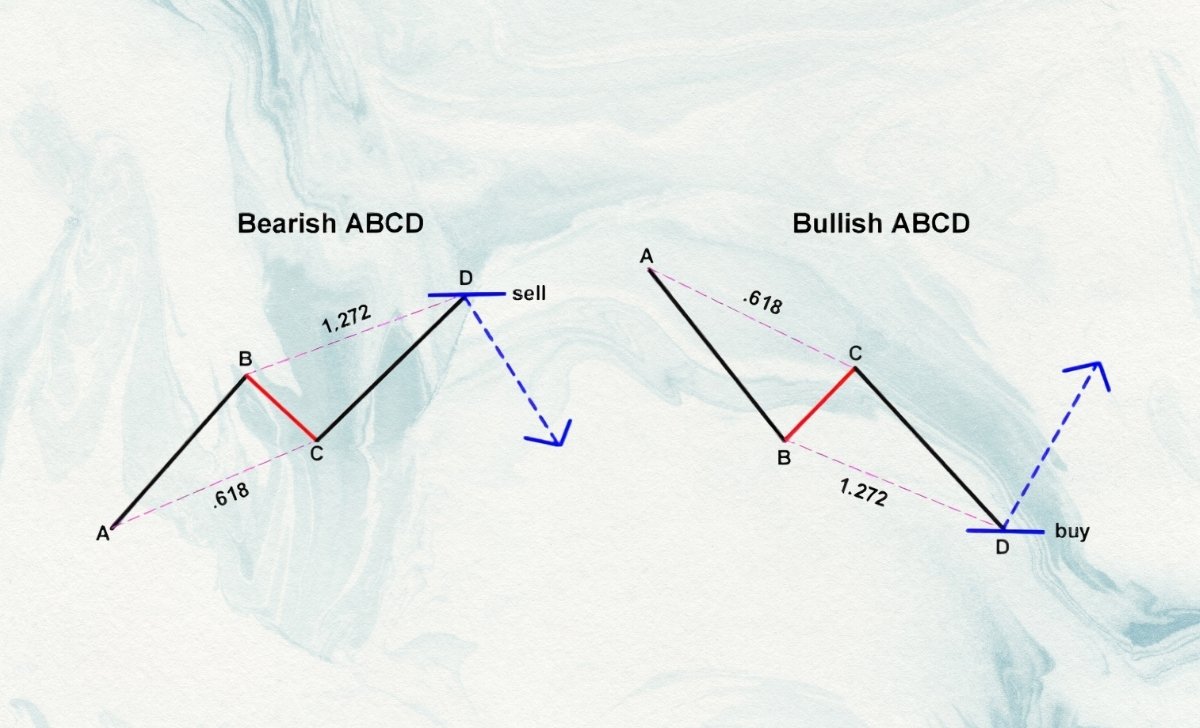
The ABCD pattern is part of harmonic patterns, and while there are many variations, the two main types are bullish ABCD and bearish ABCD patterns. Each type has distinct features and applications for different market conditions.
Bullish ABCD Pattern
The bullish ABCD pattern forms when the market is in a downtrend and then reverses sharply upward. This model helps traders identify buying opportunities when the market begins to recover.
The structure of the this pattern includes points A, B, C, and D:
- Point A is the lowest point before the market starts to rise.
- Point B is the highest point reached before the price pulls back.
- Point C is the point where the price retraces downward from B, forming a pullback.
- Point D is the next low point where the price will turn around and continue rising sharply.
This model is considered a strong buy signal, especially when the price is at point D and starts to recover. Traders can use point D as a support level to place buy orders.
Bearish ABCD Pattern
The bearish ABCD pattern is the opposite of the bullish version. It appears when the market is in an uptrend and then reverses downward. This pattern signals the end of an uptrend and the beginning of a downtrend.
The structure of this pattern mirrors that of the bullish one but in reverse:
- Point A is the highest point before the market begins to adjust.
- Point B is the lowest point before the price pulls back.
- Point C is the point where the price retraces upward from B.
- Point D is the next high point where the price will reverse and start falling sharply.
This model is typically seen as a sell signal, especially when the price reaches point D and begins to decline. Traders can use point D as a resistance level to place sell orders.
How to trade the ABCD Pattern effectively

Trading the ABCD pattern requires a deep understanding and accurate analysis of points A, B, C, and D. Here are the basic steps for trading this pattern effectively:
- Identify Point A and Point B: The first step in trading the ABCD pattern is identifying point A (the start of the trend) and point B (the highest or lowest point before the reversal). This provides the foundation for recognizing the pattern.
- Identify Point C: After identifying point B, you need to find point C, where the price retraces or pulls back. Point C should fall within reasonable support or resistance levels.
- Identify Point D: Point D is the most critical part of the ABCD pattern, where you’ll execute your trade. To ensure an accurate signal, point D should clearly confirm the trend’s continuation (either upward or downward).
- Place the Trade: Once point D is confirmed, you can execute your buy or sell order. Additionally, to reduce risk, you should use risk management tools such as stop-loss and take-profit orders.
- Monitor and Adjust: After placing your order, monitoring the price chart is crucial to adjust your position if necessary. This pattern can change with market volatility, so patience and flexibility are key.
Common mistakes to avoid when trading the ABCD Pattern

While the ABCD pattern is a powerful tool in technical analysis, improper use can lead to unfortunate mistakes in trading, especially if the Forex trading time frame is not considered properly. Here are some common mistakes traders should avoid:
- Not Confirming Point D: One of the biggest mistakes is not confirming point D properly before entering a trade. Point D should show clear confirmation from other indicators, such as technical indicators or support/resistance levels.
- Trading Too Early: Sometimes, traders may feel overly confident and enter a trade too early before the pattern is complete. This can lead to entering at the wrong time and losing money.
- Overreliance on the Model: While this pattern is helpful, it should not be the sole factor considered. Traders should combine this pattern with other analysis tools to make more accurate trading decisions.
- Not Using Risk Management: Whether trading the ABCD pattern or any other model, risk management is crucial. Not using tools like stop-loss can result in significant losses when the market moves unpredictably.
We hope that with the information provided about the ABCD Pattern in this article, you now have a clear understanding and can apply this model to your trading. Don’t forget to combine it with other analysis tools to optimize your trading decisions and achieve success!

As a Trading Coach with over 7 years of experience, I have guided both novice and experienced traders in mastering technical analysis and developing effective trading strategies. My personalized coaching approach has empowered many to enhance their skills and achieve consistent success in the forex market.
Email: [email protected]