Fibonacci is one of the most popular technical analysis tools in stock trading. Based on this sequence, investors can identify key support and resistance levels, thereby making more accurate trading decisions.
In this article, Forex Bit will help you understand the principles of Fibonacci, the most common indicators, and how to apply them effectively in stock trading.
What is Fibonacci?
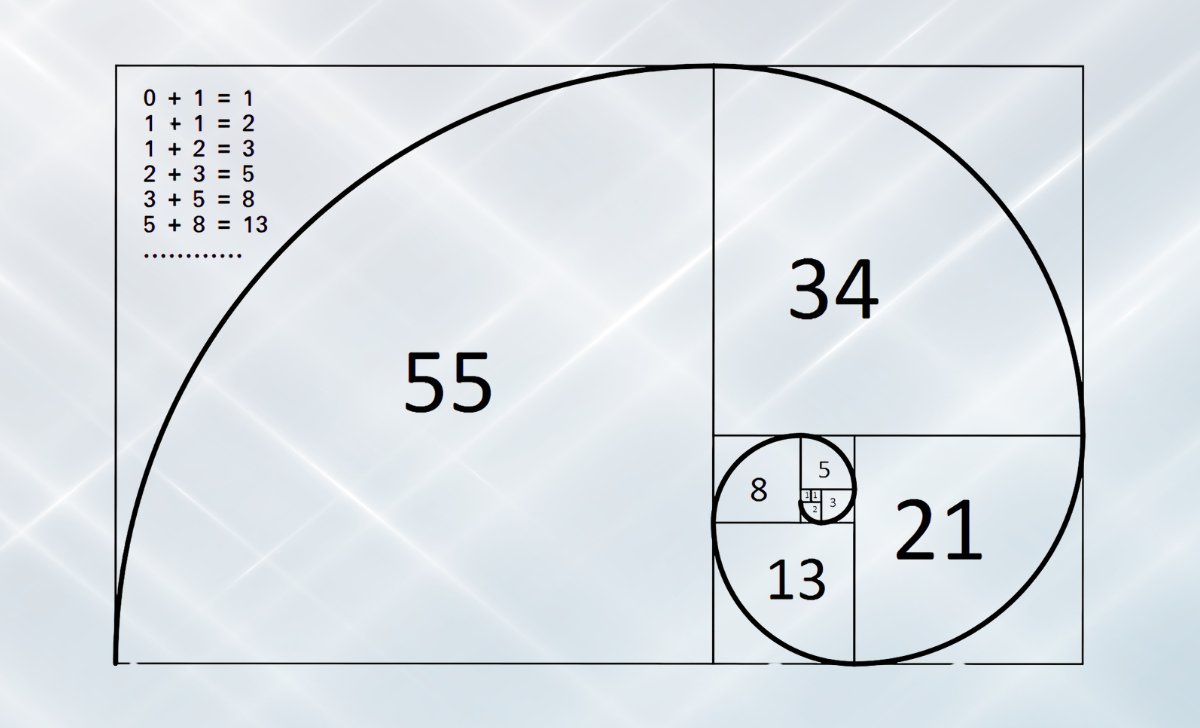
Fibonacci is a famous mathematical sequence named after the Italian mathematician Leonardo Fibonacci. This sequence starts with 0, 1, and each subsequent number is the sum of the two preceding numbers:
0, 1, 1, 2, 3, 5, 8, 13, 21, 34, 55, 89, 144…
A special characteristic of this sequence is that when dividing a number in the sequence by the next number, the result approximates 0.618 (61.8%), also known as the golden ratio. This ratio appears frequently in nature, art, and particularly in finance.
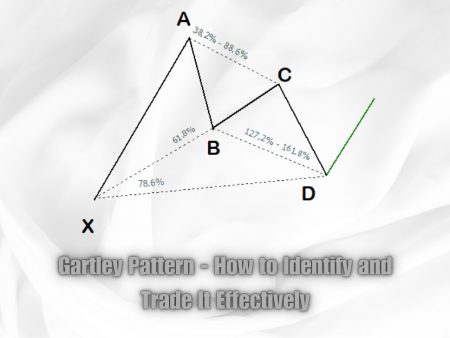
In the stock market, Fibonacci is used to determine important price levels based on Fibonacci ratios, such as 23.6%, 38.2%, 50%, 61.8%, and 78.6%. These levels help identify price reversal points, assisting investors in devising reasonable trading strategies.
Basic principles of Fibonacci in stock investment
Fibonacci operates on the principle that markets do not move in a straight line but always experience retracements. During these retracements, prices often return to support or resistance levels according to these ratios before continuing the main trend. This is especially useful in short-term trading strategies such as Scalping Forex.
Investors use Fibonacci to:
- Identify entry and exit points.
- Predict target price levels.
- Evaluate price retracement levels within a trend.
- Combine with other technical tools to optimize trading strategies.
Types of Fibonacci in stock trading
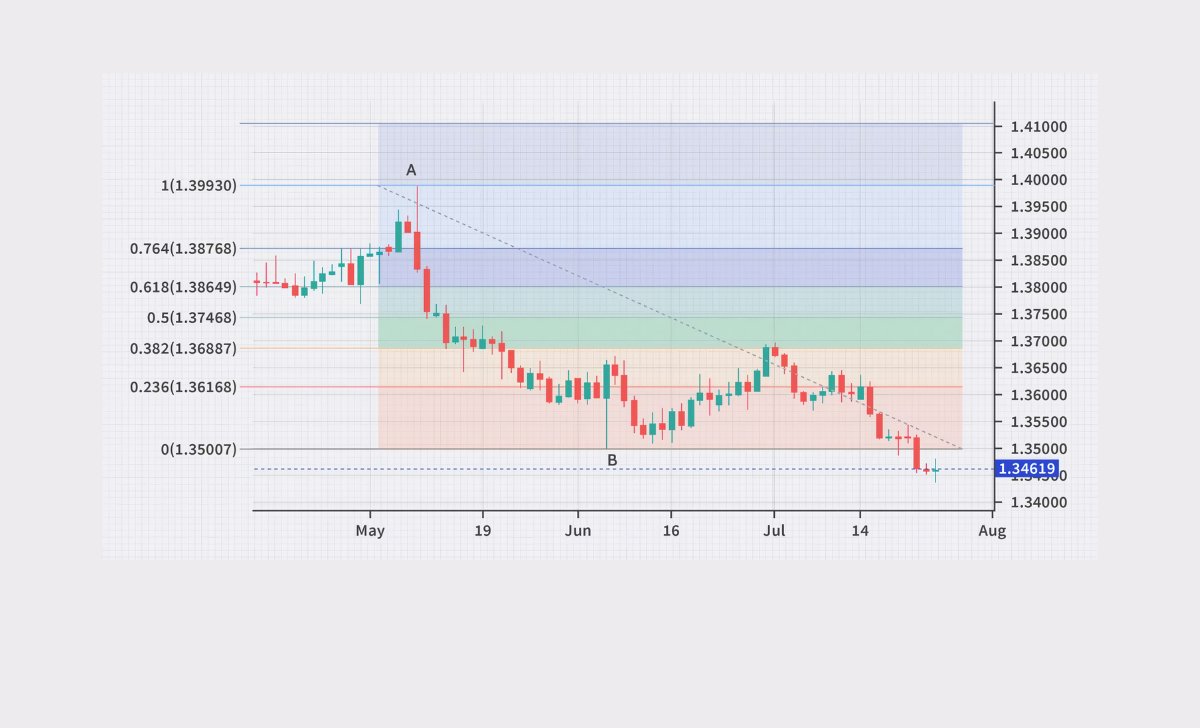
Fibonacci Retracement
Fibonacci Retracement is the most commonly used tool in technical analysis. It helps identify potential support and resistance levels when the price retraces within a trend.
Key levels in this tool include:
- 23.6% – Weak retracement; the price may continue its main trend quickly.
- 38.2% – Moderate retracement, commonly found in many trends.
- 50% – Not part of the Fibonacci sequence but considered significant according to Dow Theory.
- 61.8% – The most important level, often acting as strong support or resistance.
- 78.6% – Deep retracement; if breached, a strong reversal may occur.
Investors typically combine this tool with candlestick patterns, RSI, or MACD indicators to confirm trading signals.
Fibonacci Fans
Fibonacci Fans is a technical analysis tool that helps identify trends and predict potential future price levels. This tool works by drawing trend lines from a significant peak or trough based on Fibonacci ratios. These lines serve as support and resistance levels, helping investors determine effective entry and exit points.
Fibonacci Arc
Fibonacci Arc is a technical analysis tool used to determine retracement levels and potential price trends. It draws three curved lines on a chart, starting from the peak or trough of a trend, corresponding to key Fibonacci levels (38.2%, 50%, and 61.8%). These curves act as support and resistance levels, helping investors predict reversals and establish suitable trading strategies.
How to use Fibonacci in stock trading

To effectively use this sequence in stock trading, investors can follow these steps:
Identify the main trend
First, determine whether the market is in an uptrend or downtrend. Fibonacci works best when applied to a clear trend.
Draw Fibonacci Retracement
- In an uptrend: Draw it from the lowest point to the most recent peak to identify support levels.
- In a downtrend: Draw it from the highest point to the most recent trough to find resistance levels.
Key Fibonacci levels (23.6%, 38.2%, 50%, 61.8%, and 78.6%) help investors identify potential entry points.
Combine with other analytical tools
Fibonacci should not be used in isolation but should be combined with technical indicators to enhance accuracy:
- RSI (Relative Strength Index): Determines whether the market is overbought or oversold.
- MACD (Moving Average Convergence Divergence): Confirms price momentum and trends.
- Japanese Candlestick Patterns: Identifies key reversal signals.
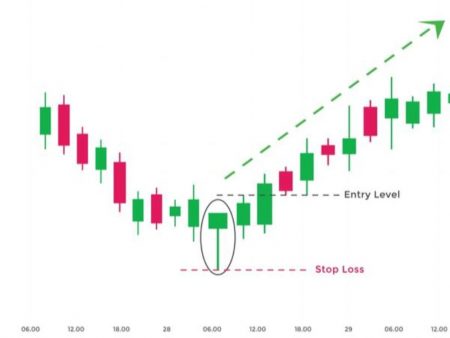
Set Stop-Loss and Take-Profit levels
- Stop-loss: Place below key Fibonacci levels if buying, or above key Fibonacci levels if selling.
- Take-profit: Set profit targets at higher Fibonacci levels or based on the desired risk-reward ratio.
Combining Fibonacci with other supporting tools will help investors optimize their trading strategies and manage risks more effectively.
Advantages and disadvantages of using Fibonacci in stock trading
Advantages
- Identifies support and resistance levels: Fibonacci helps locate price zones where trends may reverse, allowing traders to set appropriate buy or sell orders.
- Predicts potential price levels: Fibonacci levels are used to forecast retracement points of stocks or financial assets.
- Determines entry and exit points: Investors can use Fibonacci to find optimal entry points based on support and resistance levels, helping to improve accuracy when placing Forex Orders.
- Recognizes market cycles: Fibonacci helps identify price cycles and potential trend changes, supporting long-term trading strategies.
Disadvantages
- Subjectivity in trend identification: The choice of starting and ending points for drawing Fibonacci can vary among traders, leading to inconsistent analysis results.
- Non-fixed support and resistance levels: Fibonacci levels are not always precise due to continuous market fluctuations, requiring additional indicators for reliability.
- Limited accuracy in future predictions: Fibonacci reflects past price movements but does not guarantee accurate forecasts, especially in volatile markets.
- Market psychology impact: When many investors use Fibonacci, a herd effect may occur, reducing its effectiveness.
- Risk of relying solely on Fibonacci: Using Fibonacci alone without other supporting tools may lead to poor decisions due to incomplete information.
Important considerations when using Fibonacci in technical analysis

Fibonacci is a useful tool, but to maximize effectiveness, investors should keep in mind the following:
- Avoid mechanical usage: Fibonacci should be used as a reference, combined with market trends and other indicators like RSI and MACD. Relying solely on Fibonacci without considering other factors may lead to poor decisions.
- Ensure accurate Fibonacci plotting: Incorrectly selecting peaks or troughs can distort support and resistance levels, affecting trading strategies. Investors should double-check their analysis and use additional confirmation tools.
- Consider news and fundamental factors: While Fibonacci helps analyze price movements, economic news, politics, and market psychology significantly impact trends. Investors should stay updated on important events to avoid misleading signals.
Fibonacci is a valuable technical analysis tool that helps investors identify trends, support, and resistance levels in stock trading. However, to maximize its effectiveness, it should be combined with other indicators and market factors for more informed decision-making.

As a Trading Coach with over 7 years of experience, I have guided both novice and experienced traders in mastering technical analysis and developing effective trading strategies. My personalized coaching approach has empowered many to enhance their skills and achieve consistent success in the forex market.
Email: [email protected]