The Butterfly Pattern is one of the most popular Harmonic patterns, helping traders identify potential reversal points in the market. This pattern is based on Fibonacci ratios and can be applied across various financial markets, including Forex, stocks, and cryptocurrencies.
In this article, Forex Bit will guide you through a detailed exploration of the Butterfly Pattern, including how to identify it, its structure, effective trading strategies, and key considerations when using it!
What is the Butterfly Pattern?
The Butterfly Pattern is a Harmonic pattern that helps traders identify reversal points based on Fibonacci ratios. It typically appears at the end of a trend, signaling a strong potential reversal.
This Pattern was created by Bryce Gilmore and Larry Pesavento, two leading experts in technical analysis. One of its key characteristics is that it extends beyond the Gartley pattern, with point D surpassing point X, creating highly profitable trading opportunities.
When identified correctly, the Butterfly Pattern allows traders to enter trades with high success probability, thanks to its reliable Fibonacci levels.
Structure of the Butterfly Pattern
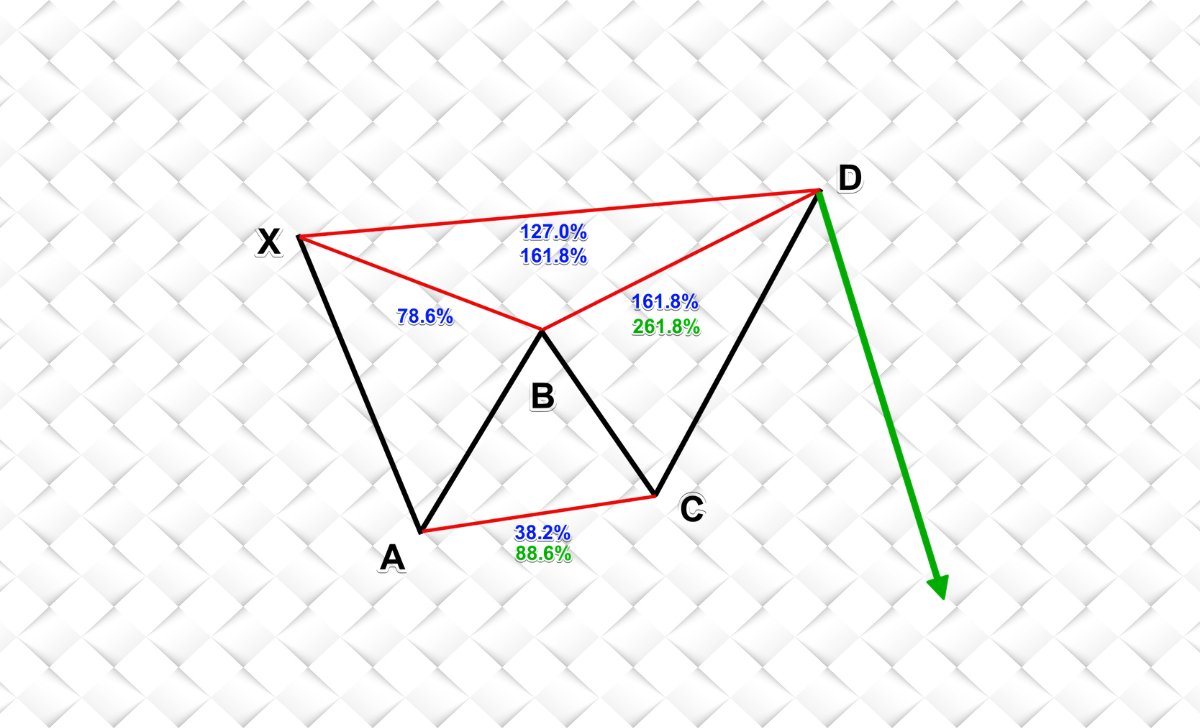
This Pattern consists of four key price swings: XA, AB, BC and CD, following specific Fibonacci ratios:
- XA: The first leg of the pattern.
- AB: Retraces XA, typically reaching 78.6% Fibonacci retracement.
- BC: A counter-move, retracing between 38.2% – 88.6% of AB.
- CD: The final leg, extending between 161.8% – 261.8% of BC and 127.2% – 161.8% of XA.
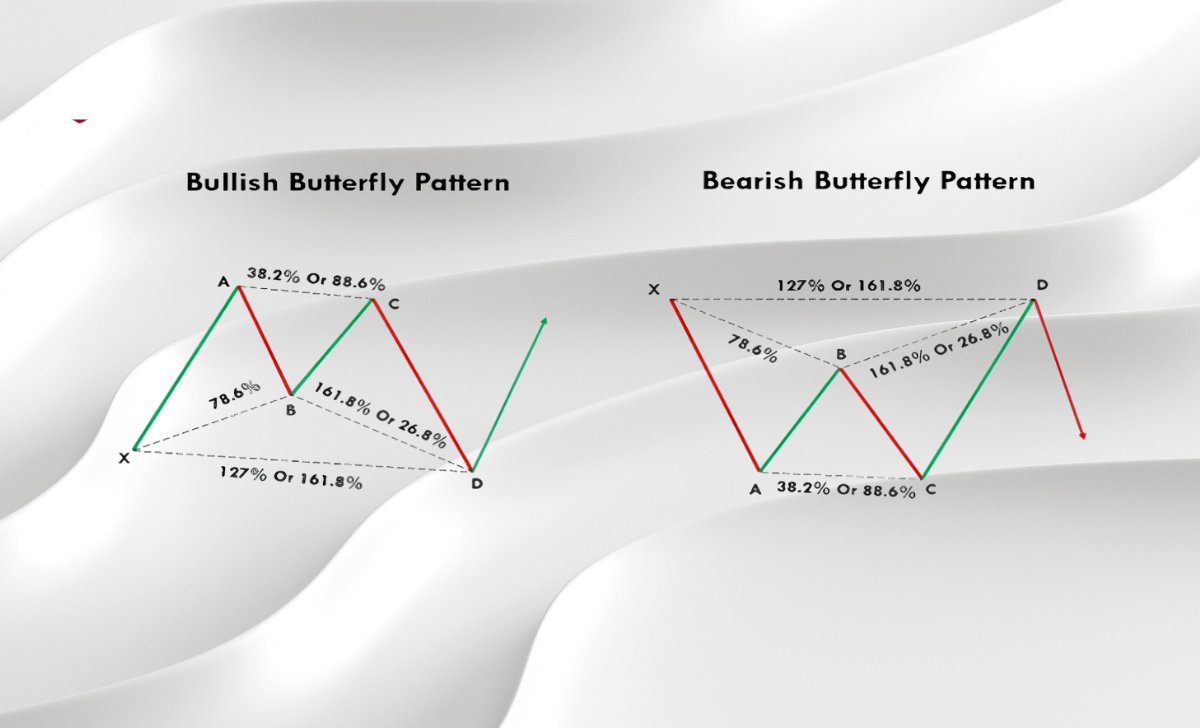
Two Variants of the Butterfly Pattern
Bullish Butterfly Pattern
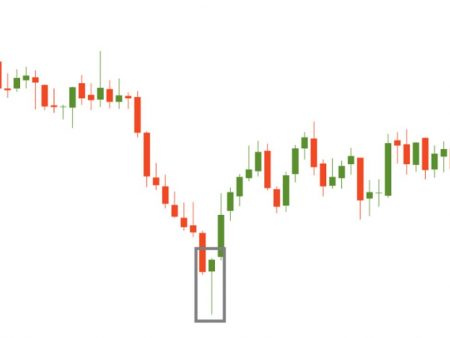
A Bullish Butterfly Pattern forms when price declines sharply and reaches a strong support level at point D, signaling a potential uptrend reversal.
Key Features:
- Point D is lower than point X, typically extending to 127.2% – 161.8% of XA.
- Traders look for buying opportunities at point D, expecting the price to reverse upwards.
- Stop-loss is placed slightly below point D to avoid premature stop-outs.
Bearish Butterfly Pattern
A Bearish Butterfly Pattern forms when price rises sharply to a strong resistance level at point D, indicating a potential downtrend reversal.
Key Features:
- Point D is higher than point X, extending to 127.2% – 161.8% of XA.
- Traders look for selling opportunities at point D, expecting the price to drop.
- Stop-loss is placed above point D to minimize risk.
Pros and cons of the Butterfly Pattern
Before using this pattern in trading, it’s essential to understand its advantages and limitations to maximize opportunities while minimizing risks.
Pros
- High Accuracy: The Butterfly Pattern is based on precise Fibonacci levels, helping traders accurately identify reversal points, reducing risk and increasing success rates.
- Applicable to Multiple Markets: This pattern can be used in Forex, stocks, cryptocurrencies, gold, and other financial assets, making it versatile in different market conditions.
- Good Risk-Reward Ratio: When entering point D, traders can place a tight stop-loss while aiming for large profit targets, optimizing risk-reward ratios.
Cons:
- Difficult to Identify: Traders must accurately measure Fibonacci levels and wave structures, requiring experience. Misidentification can lead to less reliable signals.
- Prone to Breakouts: In highly volatile markets or news-driven events, the pattern may fail or not work as expected. Traders should use additional confirmation factors to avoid false signals.
- Cannot Be Used in Isolation: This Pattern is a supporting tool, not a standalone strategy. Traders should combine it with technical indicators like RSI, MACD, or Bollinger Bands for higher accuracy.
Trading strategy with the Butterfly Pattern

To trade the this Pattern effectively, follow these steps to maximize profits and minimize risks.
Step 1: Identify the Butterfly Pattern
- Use Fibonacci Retracement and Fibonacci Extension tools to measure price swings.
- Verify Fibonacci ratios to ensure a valid pattern before entering a trade.
Step 2: Wait for the Price to Reach Point D
- Point D is the most crucial level for trade entries.
- Combine with overbought/oversold RSI signals and high trading volume for confirmation.
Step 3: Enter Trade
- Bullish Butterfly: Place a BUY order at point D, with a stop-loss below D to manage risk.
- Bearish Butterfly: Place a SELL order at point D, with a stop-loss above D for protection.
Step 4: Set Take-Profit Targets
- TP1: Take partial profit at 38.2% – 50% of CD, suitable for low volatility markets.
- TP2: Aim for 61.8% – 78.6% of CD, ideal for strong trends.
Key considerations when using the Butterfly Pattern

While the Butterfly Pattern is a powerful tool, traders should incorporate additional factors and risk management principles for better trading results.
- Combine with Other Indicators: Never rely solely on this Pattern; use indicators like RSI, MACD, or Bollinger Bands to increase accuracy.
- Monitor Trading Volume: If price reaches point D without significant volume, the reversal may not be strong, increasing the risk of pattern failure.
- Practice on a Demo Account: Before using real capital, practice on a demo account to understand the pattern and avoid costly mistakes.
- Implement Proper Risk Management: Always set stop-loss orders to protect capital and avoid overexposure in a single trade. Proper risk management ensures long-term trading success.
The Butterfly Pattern is a powerful tool that helps traders identify high-probability reversal points when combined with accurate Fibonacci levels. Hopefully, this article has provided you with a clear understanding of how to identify, trade, and leverage this pattern to optimize your profits in the financial markets.

As a Trading Coach with over 7 years of experience, I have guided both novice and experienced traders in mastering technical analysis and developing effective trading strategies. My personalized coaching approach has empowered many to enhance their skills and achieve consistent success in the forex market.
Email: [email protected]