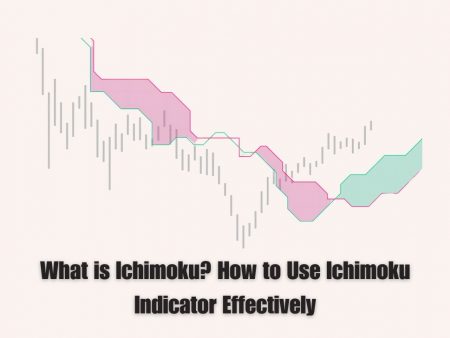
The Impulse Wave Pattern is a crucial model in Elliott Wave Theory, helping traders identify the primary market trend. It not only assists in spotting trading opportunities but also provides key signals to optimize investment strategies.
In this article, Forex Bit will help you understand the definition, structure, trading methods, real-world examples, and common mistakes when applying this pattern.
What is the Impulse Wave Pattern?
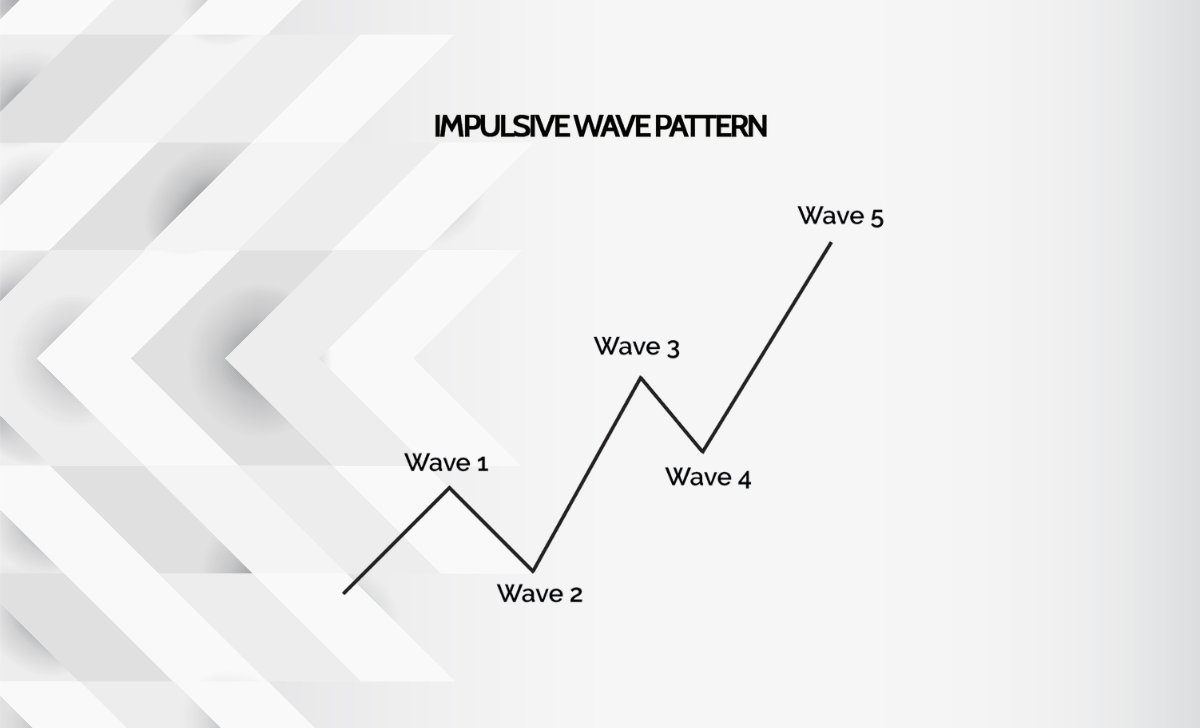
The Impulse Wave Pattern is a fundamental part of Elliott Wave Theory, reflecting price movements in line with the market’s primary trend. According to the principles, this pattern consists of five main waves, including three trend-following waves (waves 1, 3, and 5) and two corrective waves moving against the trend (waves 2 and 4).
The Impulse Wave often appears in strong trending markets, indicating a clear dominance of buyers or sellers. This is a key signal for traders to effectively determine entry and exit points.
Characteristics of this pattern:
- The pattern consists of five waves in total.
- Waves 1, 3, and 5 move in the direction of the main trend.
- Waves 2 and 4 are corrective waves.
- Wave 3 is always the strongest and can never be the shortest wave.
This pattern is widely used in stock trading, Forex, and cryptocurrency markets to analyze price trends and develop trading strategies.
Structure of the Impulse Wave Pattern

The Impulse Wave Pattern follows a specific structure with clear rules. Below is how this pattern is formed:
5 Waves in the Impulse Wave Pattern
Each wave in the Impulse Wave Pattern forms and moves on the market as follows:
- Wave 1: This marks the beginning of a new trend when some traders start entering the market. The buying or selling pressure is still weak but strong enough to cause a price shift.
- Wave 2: After the price moves up or down in Wave 1, the market enters a mild correction phase. Some investors take profits, causing the price to pull back, but it does not break below the starting point of Wave 1.
- Wave 3: This is the strongest wave in the pattern, usually with the largest amplitude. A surge in buying or selling pressure pushes the price further, attracting more investors to join the trend.
- Wave 4: The market temporarily corrects after the strong move in Wave 3. However, the price does not fall deep into the price range of Wave 1, maintaining the structure of the pattern.
- Wave 5: This is the final wave in the primary trend, continuing to push the price in the direction of the pattern. However, the momentum may be weaker than Wave 3 due to the market’s declining strength.
Key Rules of the Impulse Wave Pattern
The following rules help traders accurately identify this pattern and avoid misinterpretation:
- Wave 2 must not fall below the starting point of Wave 1. If the price drops beyond this level, the pattern is invalidated.
- Wave 3 is never the shortest wave. It always has the largest amplitude or demonstrates the strongest market force in the pattern.
- Wave 4 must not enter the price range of Wave 1. If the price pulls back too deeply into Wave 1’s territory, the wave structure no longer aligns with Elliott Wave Theory.
Effective Trading Strategies with the Impulse Wave Pattern

Applying the Impulse Wave Pattern correctly can help traders identify optimal entry and exit points. Below are some effective trading strategies:
Step 1: Identify the Pattern
- Check if the price forms a 5-wave structure.
- Ensure Wave 3 is stronger than Wave 1 and is not the shortest wave.
- Use technical indicators like Fibonacci retracement, RSI, and MACD to confirm the pattern.
Step 2: Enter Trades at Key Levels
- Enter a buy order at the end of Wave 2 when the price corrects but does not break below the start of Wave 1.
- Enter a strong buy order at the beginning of Wave 3, as it has the largest price movement.
- Enter a buy order at the start of Wave 5, but with caution, as this is the final wave of the trend.
Step 3: Set Stop Loss and Take Profit
- Stop Loss should be placed just below the low of Wave 2 or the low of Wave 4.
- Take Profit can be set at 161.8% Fibonacci extension of Wave 3 or near a key resistance level.
Using the Impulse Wave Pattern alongside other technical analysis tools can significantly increase the probability of successful trades.
Real-World Example of the Impulse Wave Pattern
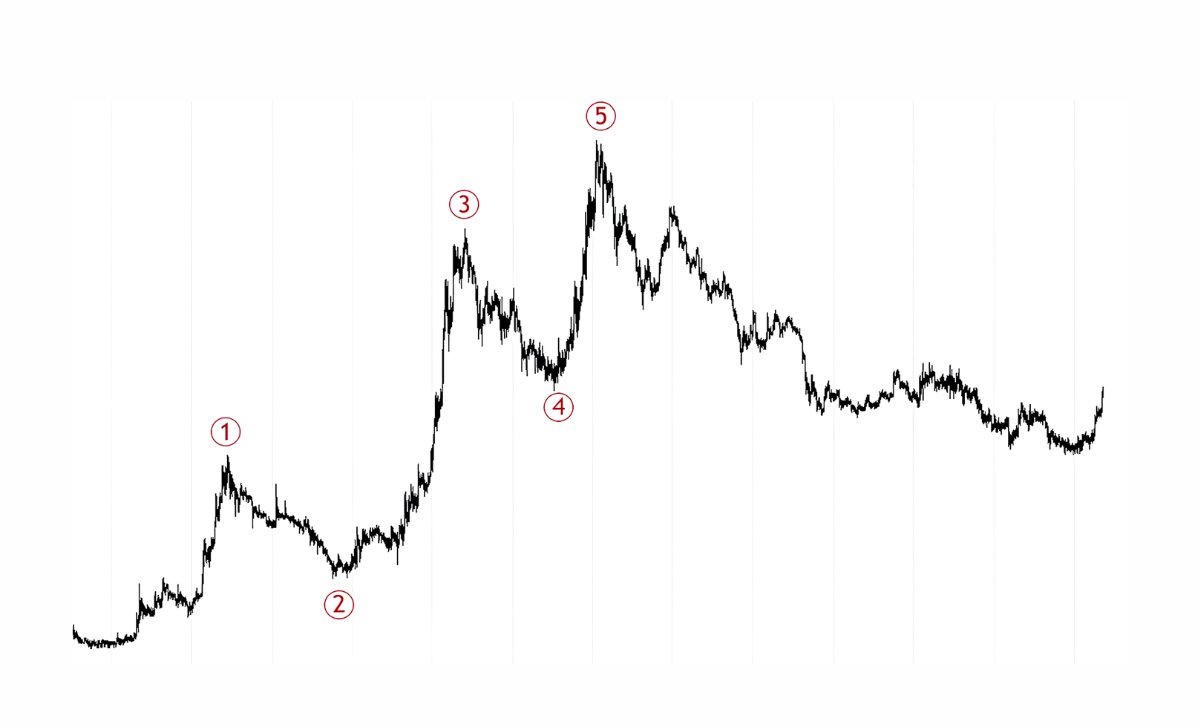
To better understand this concept, let’s analyze a real example on a price chart. Suppose we are tracking the EUR/USD currency pair on a 4-hour timeframe and identifying a complete Impulse Wave Pattern:
- Wave 1: The price starts rising from 1.1000 to 1.1200, marking the beginning of an uptrend. Buying pressure emerges but remains relatively weak, mainly driven by early market participants.
- Wave 2: The price rises from 1.1200 to 1.1150 as some investors take profits. However, this decline does not break below the starting point of Wave 1 (1.1000), confirming it as a minor correction.
- Wave 3: The price surges from 1.1150 to 1.1500, making it the strongest wave in the pattern. This phase sees dominant buying pressure, attracting more traders and pushing prices higher.
- Wave 4: The price retraces to 1.1450 but does not enter the price range of Wave 1 (1.1200). This ensures the pattern remains valid according to Elliott Wave principles.
- Wave 5: The price continues to rise to 1.1600, but the market momentum is weaker compared to Wave 3. Shortly after, a significant correction occurs, signaling the end of the Impulse Wave.
Trading Analysis from the Example:
- Entry Points: Traders could enter a buy order at the end of Wave 2 (1.1150) or at the start of Wave 3 (1.1200 – 1.1250) to capitalize on the strong uptrend.
- Stop Loss Placement: A reasonable Stop Loss should be set just below the low of Wave 2 (around 1.1100) to minimize risk.
- Take Profit Strategy: Profit targets can be placed at the 161.8% Fibonacci extension of Wave 3 or just before a key resistance level (1.1600).
Common Mistakes When Trading with the Impulse Wave Pattern

Below are some common mistakes that many traders make when applying the Impulse Wave Pattern in trading:
- Misidentifying the Pattern: Many traders confuse the Impulse Wave with other patterns like the Corrective Wave or Triangle Pattern. Incorrect identification can lead to ineffective trades and losses.
- Ignoring Elliott Wave Rules: If Wave 3 is too weak or Wave 4 enters the price range of Wave 1, the pattern becomes invalid. This can result in poor trading decisions and missed opportunities.
- Over-reliance on the Pattern Without Using Other Tools: Relying solely on the Impulse Wave without integrating other tools like Fibonacci, RSI, or MACD reduces the accuracy of analysis. Combining these indicators increases the probability of successful trades.
- Lack of Risk Management: Many traders fail to set Stop Loss orders or place them too far away, exposing their accounts to significant risk if the market moves against them. Effective risk management is crucial to protect capital and maximize profits.
The Impulse Wave Pattern is a powerful tool in technical analysis, helping traders identify market trends and optimize trading strategies. However, to use it effectively, you must follow Elliott Wave rules, combine it with other technical tools, and apply strict risk management!

As a Trading Coach with over 7 years of experience, I have guided both novice and experienced traders in mastering technical analysis and developing effective trading strategies. My personalized coaching approach has empowered many to enhance their skills and achieve consistent success in the forex market.
Email: [email protected]