Multiple timeframes analysis is a method that provides investors with a more comprehensive view of the market by combining different timeframes. It not only helps identify the main trend but also assists in finding optimal entry and exit points.
In this article, Forex Bit will guide you through the definition, common timeframes, reasons for using this method, how to apply it, mistakes to avoid, and useful tools to optimize your trades!
What is Multiple Timeframe Analysis?
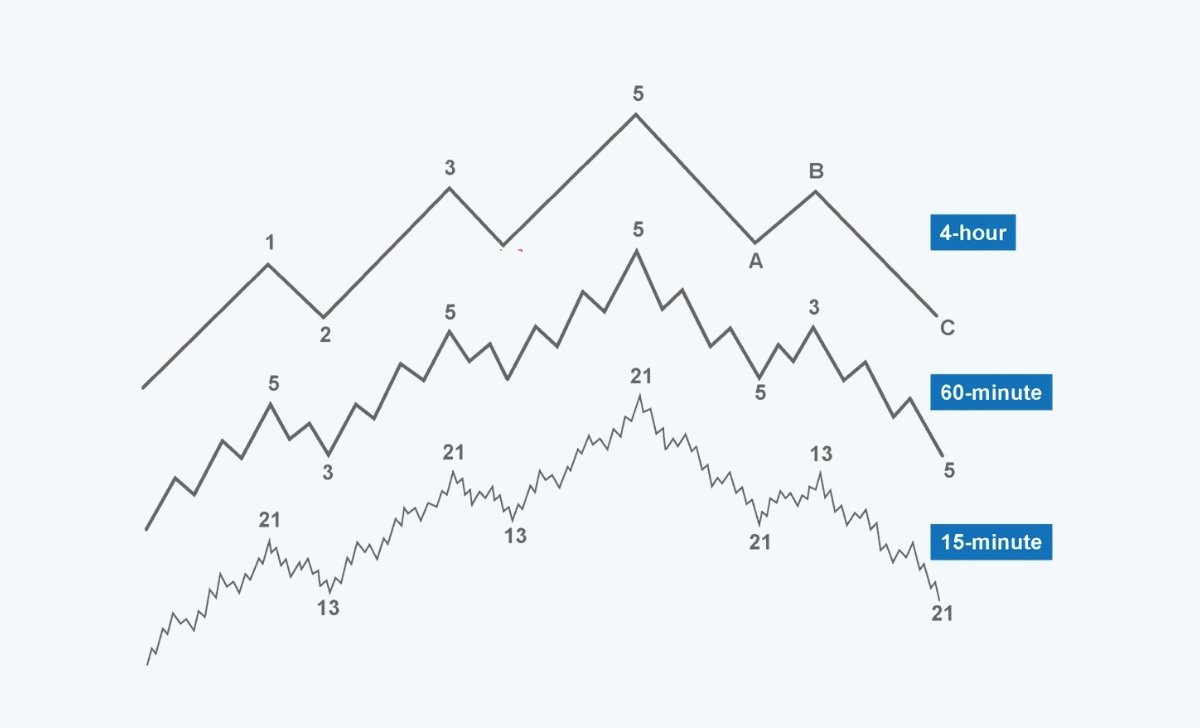
Multiple timeframes analysis is a market analysis method that involves using various timeframes to determine overall trends, entry points, and exit points. Instead of relying on a single chart, traders use multiple timeframes to gain a broader perspective on price movements.
For example, if you are trading Forex using a 1-hour chart, you can combine it with a 4-hour chart to capture a longer-term trend or use a 15-minute chart to identify more precise entry points.
Common Types of Timeframes
In multiple timeframe analysis, traders typically combine three key timeframes:
- Long-term timeframe: This timeframe helps identify the overall market trend, guiding investors on whether to prioritize buying or selling. Common examples include the daily (D1) or weekly (W1) chart.
- Medium-term timeframe: Used to confirm the trend from the long-term timeframe and identify reasonable trading opportunities. A common example is the 4-hour (H4) chart.
- Short-term timeframe: This timeframe helps pinpoint precise entry and exit points to maximize profits. Common examples include the 15-minute (M15) or 1-hour (H1) chart.
Using multiple timeframes allows investors to avoid misleading signals and gain a clearer understanding of the market’s true trend.
Why Use Multiple Timeframes?
Multiple timeframe analysis provides investors with a more comprehensive market view, helping them avoid misleading signals and make more accurate trading decisions. Here are three key reasons to apply this method:
- Identify the Overall Trend: Analyzing a single timeframe may cause traders to miss crucial signals. For example, an uptrend on a 15-minute chart might only be a minor pullback within a downtrend on the 4-hour chart.
- Minimize Trading Risks: By combining multiple timeframes, traders can avoid false signals and reduce the risk of poor trade entries. This improves the win rate and optimizes profits.
- Confirm Precise Entry and Exit Points: Multiple timeframe analysis helps traders find better entry points by aligning the overall trend with short-term price action. For instance, if the long-term chart indicates an uptrend, waiting for a pullback on the medium-term chart can offer a lower-risk entry opportunity.
How to Apply Multiple Timeframe Analysis in Trading

Choosing the Right Timeframes
Each trader selects different timeframes based on their trading style:
- Scalpers (Quick trades, short-term strategies): Combine M1 (1-minute), M5 (5-minute), and M15 (15-minute) charts to take advantage of short-term price movements.
- Day Traders (Intraday trading): Use M15 (15-minute), H1 (1-hour), and H4 (4-hour) charts to find trading opportunities within the same day.
- Swing Traders (Medium-term trading): Combine H4 (4-hour), D1 (daily), and W1 (weekly) charts to follow longer-term trends.
The key is to choose timeframes with logical connections, usually in a 1:4 or 1:6 ratio, to ensure effective synchronization between them.
How to Combine Multiple Timeframes for Optimal Trading
Here are the steps traders can follow to integrate multiple timeframes and optimize their trading strategies:
Step 1: Identify the Main Trend on the Long-Term Chart
- Analyze the overall market trend (uptrend, downtrend, or sideways).
- Use technical tools such as moving averages (MA), trendlines or MACD indicators to confirm the trend.
Step 2: Confirm Trade Signals on the Medium-Term Chart
- If the long-term chart indicates an uptrend, check whether the medium-term chart shows a pullback.
- Look for reversal candlestick patterns, key support/resistance levels to determine the best entry zones.
Step 3: Find Entry Points on the Short-Term Chart
- Use a lower timeframe to pinpoint the exact entry timing.
- Rely on technical indicators such as RSI, Stochastic, or Price Action strategies to confirm signals before entering a trade.
By combining timeframes effectively, traders can make more precise decisions, reduce risks, and optimize their trading profitability.
Common Mistakes to Avoid When Using Multiple Timeframes

Using multiple timeframes can improve trading efficiency, but if applied incorrectly, it may lead to unnecessary risks. Here are three common mistakes to avoid:
- Using too many timeframes: Analyzing too many timeframes can be overwhelming and make decision-making difficult. Simplify your approach by focusing on just 2-3 key timeframes to track trends effectively.
- Lack of trend synchronization between timeframes: If the long-term timeframe shows an uptrend but the short-term timeframe is in a downtrend, it could be just a minor pullback. Ensure that important timeframes are aligned to avoid misleading signals.
- Relying on a single timeframe for entries: Entering trades based only on a lower timeframe without checking the overall trend can lead to trading against the main trend. This increases risk and may result in poor decisions.
Tools for Multiple Timeframe Analysis

Several tools are available to help traders analyze multiple timeframes efficiently and make more informed decisions. Here are some of the most popular platforms:
- TradingView: Supports multi-timeframe charting, allowing traders to open multiple windows side by side for trend comparison. This user-friendly tool is ideal for both beginners and professional traders.
- MetaTrader 4 & 5: Offers powerful analytical tools to monitor multiple timeframes within the same platform. Built-in technical indicators help traders identify trends and entry points more easily.
- ThinkorSwim: Suitable for stock and futures traders, providing detailed market data. This platform supports advanced technical analysis and highly customizable charting options.
Multiple timeframe analysis is a powerful strategy that gives traders a broader market perspective, reduces risks, and helps identify optimal entry points. When applied correctly, this method can significantly enhance trading performance and improve success rates!

As a Trading Coach with over 7 years of experience, I have guided both novice and experienced traders in mastering technical analysis and developing effective trading strategies. My personalized coaching approach has empowered many to enhance their skills and achieve consistent success in the forex market.
Email: [email protected]