Corrective Wave is one of the key concepts in Elliott Wave Theory, helping traders identify market correction phases. It typically appears in an A-B-C pattern, reflecting a temporary pause in the main trend before continuing its movement.
In this article, Forex Bit will dive deep into the definition, structure, common patterns, and practical applications of Corrective Waves in trading!
What is a Corrective Wave?
A Corrective Wave is a market adjustment phase following a primary trend, often taking the form of sideways price movements or moves against the main trend. According to Elliott Wave Theory, a complete market cycle consists of two types of waves:
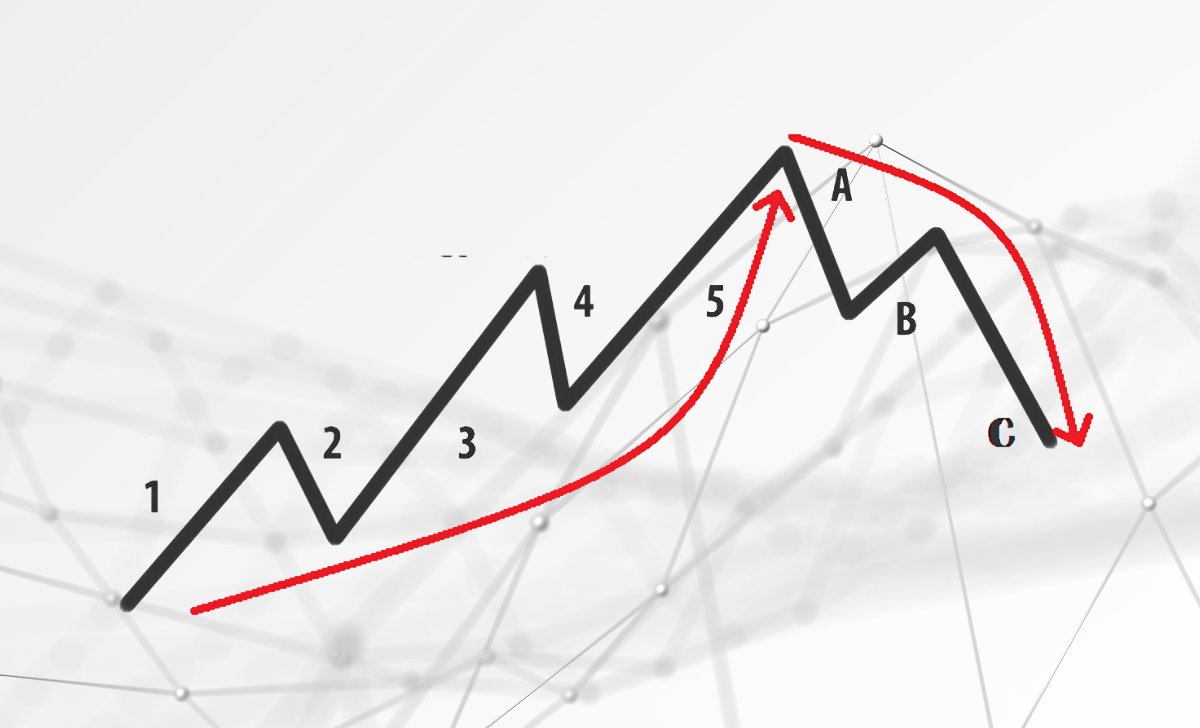
- Impulse Wave: Consists of five waves moving in the direction of the main trend.
- Corrective Wave: Consists of three waves (A-B-C) moving against the main trend.
This waves reflect the tug-of-war between buyers and sellers before the main trend resumes. Although they can make it challenging for traders to determine entry points, understanding the nature of Corrective allows you to leverage them for optimal profits.
Structure of Corrective Waves in Elliott Wave Theory
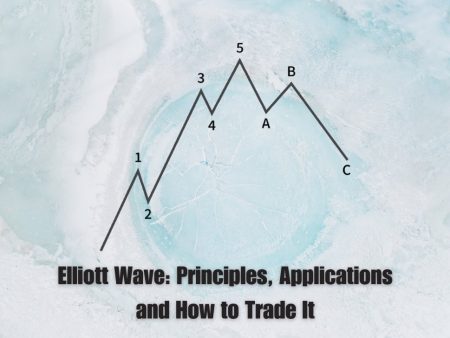
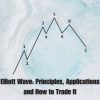
Elliott identified that corrective waves typically follow a three-wave A-B-C structure, in which:
- Wave A: This is the first corrective wave, occurring when the market temporarily moves against the main trend. If the prior trend was upward, Wave A represents a decline. Conversely, if the market was in a downtrend, Wave A would be an upward movement.
- Wave B: This is a temporary recovery wave after Wave A, but it is not strong enough to surpass the previous peak (in a downtrend) or the previous low (in an uptrend). This often misleads traders into believing that the main trend has resumed, while in reality, Wave C has yet to form.
- Wave C: The final wave of this pattern, continuing in the direction of Wave A. Wave C is often of similar length or even stronger than Wave A, marking the completion of the correction before the market resumes its primary trend.
This structure helps traders determine when the main trend may resume. In particular, using Fibonacci retracement in combination with this waves can help identify key support and resistance levels.
Common Corrective Wave Patterns
In practice, this patterns are not limited to the simple A-B-C structure but can take various forms. Below are the most common this wave patterns:
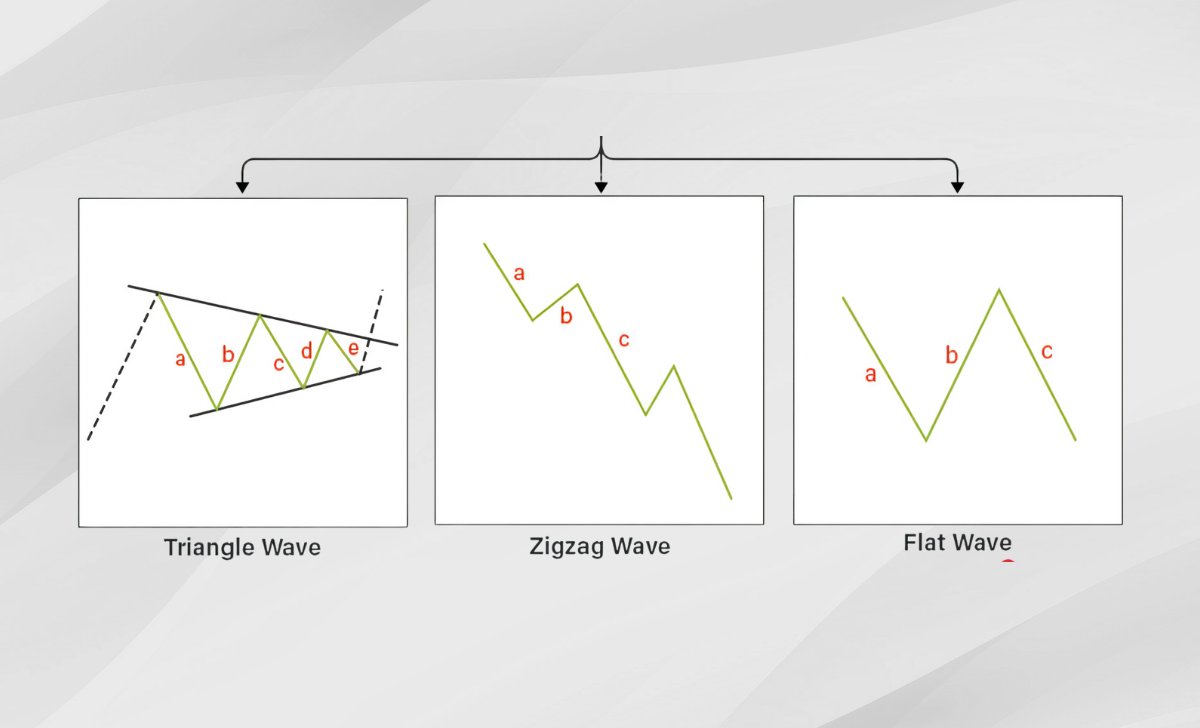
Zigzag
The Zigzag pattern often appears during strong market corrections. It consists of three waves (A-B-C) with the following characteristics:
- Waves A and C have a five-wave (Impulse Wave) structure.
- Wave B has a three-wave (Corrective Wave) structure.
- The Zigzag pattern has a steep slope, indicating a strong correction.
Flat
The flat pattern occurs when the market moves sideways within a narrow range. There are three main types:
- Regular Flat: Wave B is nearly equal to Wave A, and Wave C is of similar or shorter length.
- Expanded Flat: Wave B surpasses the height/low of Wave A, and Wave C is longer than Wave A.
- Running Flat: Wave B is stronger than Wave A, but Wave C is shorter.
Triangle
The Triangle pattern typically forms before major breakouts and consists of five corrective waves (A-B-C-D-E). There are three main types:
- Ascending Triangle: Price forms higher lows while resistance remains unchanged.
- Descending Triangle: Price forms lower highs while support remains unchanged.
- Symmetrical Triangle: Price gradually converges toward a point.
Combination
Some this waves do not follow a simple pattern but combine multiple corrective structures, such as Zigzag + Flat or Triangle + Zigzag, forming more complex W-X-Y or W-X-Y-Z patterns.
How to Trade Using Corrective Waves

Trading with Corrective Waves requires traders to thoroughly understand the A-B-C wave structure and effectively combine technical analysis tools to optimize entry points, exits, and risk management. Below is a detailed guide to help you leverage this pattern for successful trading:
Identifying Entry Points
- Use Fibonacci Retracement to identify key support/resistance levels within the corrective wave.
- Observe reversal candlestick patterns or signals from RSI, MACD to confirm entry points.
- If the market is in a strong primary trend, corrective waves present an opportunity to enter trades in the direction of the main trend.
Determining Exit Points
- If trading against the primary trend, take profits at key Fibonacci levels (38.2% – 61.8%).
- If trading with the main trend, consider holding the position and placing a stop-loss below/above the end of the Corrective Wave.
Risk Management
- Set a reasonable stop-loss based on the wave structure.
- Avoid excessive trading during sideways market phases with flat or triangle patterns.
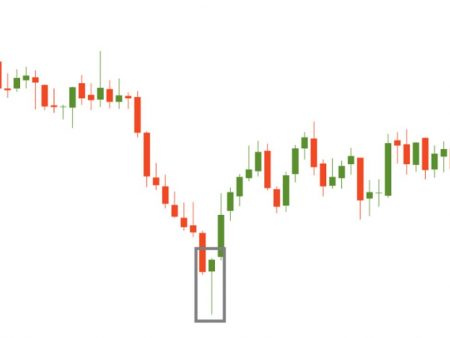
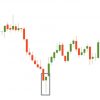
Real-World Example of the Corrective Wave Pattern
To better understand how to apply Corrective Waves in trading, let’s analyze a real example on the EUR/USD chart.
Market Context
- The EUR/USD pair is in a strong uptrend, with prices continuously forming higher highs and higher lows.
- After an extended rally, the price starts to correct, forming an A-B-C pattern.
Identifying the Corrective Wave
- Wave A: Price drops from 1.1200 to 1.1000, marking the first correction against the main trend.
- Wave B: Price recovers to 1.1100 but fails to surpass the previous high (1.1200), indicating a temporary pullback.
- Wave C: Price continues to decline sharply to 1.0950, forming a lower low compared to Wave A, completing the A-B-C structure.
Trading Strategy
- Entry Point Identification:
- Fibonacci Retracement indicates the 61.8% level at 1.0950, a strong support zone.
- A Bullish Engulfing candlestick pattern appears, combined with RSI below 30 (oversold condition).
- These signals confirm a buy (long) entry, expecting the uptrend to resume.
- Take Profit & Stop Loss:
- Take Profit: Set at 1.1150 (near the previous high).
- Stop Loss: Placed below 1.0930 to avoid stop-loss hunting.
Result:
The price rebounded from 1.0950 to 1.1150, securing a 200-pip profit.
Corrective Waves are a powerful tool for traders to identify market corrections and spot high-probability trading opportunities within the main trend. Apply this knowledge to market analysis and practice trading to enhance your skills and maximize profits!

As a Trading Coach with over 7 years of experience, I have guided both novice and experienced traders in mastering technical analysis and developing effective trading strategies. My personalized coaching approach has empowered many to enhance their skills and achieve consistent success in the forex market.
Email: [email protected]