Elliott Wave is one of the most important tools in technical analysis, helping investors identify market trends. This wave follows the principles of crowd psychology, reflecting price fluctuation cycles through specific patterns.
To gain a deeper understanding of the principles, structure, and application of Elliott Wave in trading, let’s explore the details with Forex Bit in this article!
Introduction to Elliott Wave
What is Elliott Wave?
Elliott Wave is a technical analysis method based on the hypothesis that financial markets move in repetitive patterns, reflecting the collective psychology of investors. These patterns are structured into “waves” that illustrate price cycles of rises and declines.
History of Elliott Wave
Ralph Nelson Elliott, an American accountant, analyzed market data for many years and discovered that stock prices do not fluctuate randomly but follow a systematic pattern. In 1938, he officially introduced the Elliott Wave Theory in his book The Wave Principle, pioneering a new approach to technical analysis.
Why is Elliott Wave important?
Elliott Wave is essential for several reasons:
- Predicting market trends: Helps identify upward/downward price trends.
- Determining entry and exit points: Investors can use it to find optimal trade entry/exit points.
- Applicable to various asset types: Can be used in stock, Forex, crypto, and commodity trading.
Structure of Elliott Wave
Elliott Wave Theory categorizes price movements into two main types of waves:
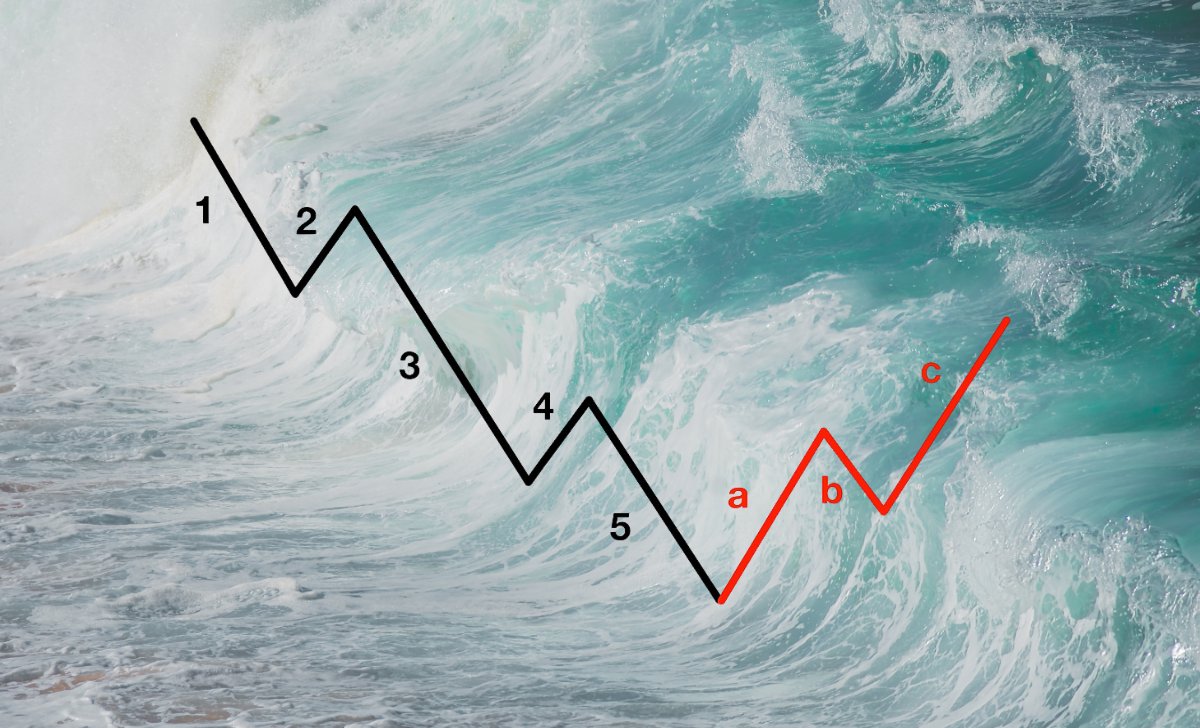
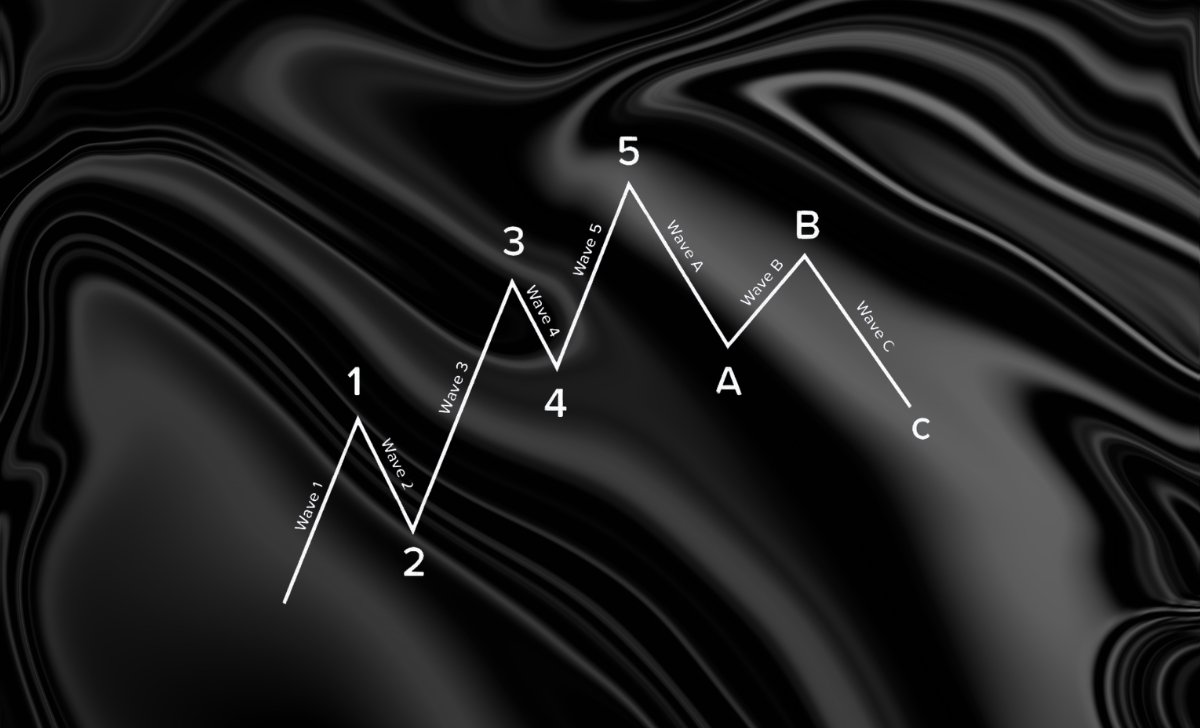
Impulse Wave
This consists of a five-wave pattern that moves in the direction of the main market trend:
- Wave 1: Initiates a new trend but is not yet clear; market sentiment is still influenced by the previous trend. Trading volume slightly increases but does not attract significant attention.
- Wave 2: Pulls back but does not break the low of Wave 1. Negative news still dominates, but some positive signals begin to appear.
- Wave 3: The strongest wave, often extending by a ratio of 1.618 times Wave 1. At this stage, the market becomes highly active, prices rise rapidly, and many investors join in.
- Wave 4: A minor pullback, usually not exceeding 38.2% of Wave 3. Trading volume declines, which may cause impatience among investors, but this presents a buying opportunity before Wave 5.
- Wave 5: The final wave is the main trend, with the market at its most optimistic. However, this phase often attracts new investors who face potential risks.
Corrective Wave
The corrective wave consists of three smaller phases, reflecting the market’s adjustment before establishing a new trend:
- Wave A: Prices start to decline but are not yet evident; news remains relatively positive. However, selling pressure gradually increases, signaling a shift in market sentiment.
- Wave B: A short-term recovery with a slight price increase but does not surpass the previous high. Trading volume declines, and the market remains hesitant without clear negative signs.
- Wave C: A stronger decline, breaking below the low of Wave A. Trading volume spikes, and Wave C is often equal to or larger than Wave A, sometimes extending to 1.618 times Wave A.
Modern Elliott Wave patterns
Despite its complexity with various variations, the following are some of the most notable Elliott Wave patterns:
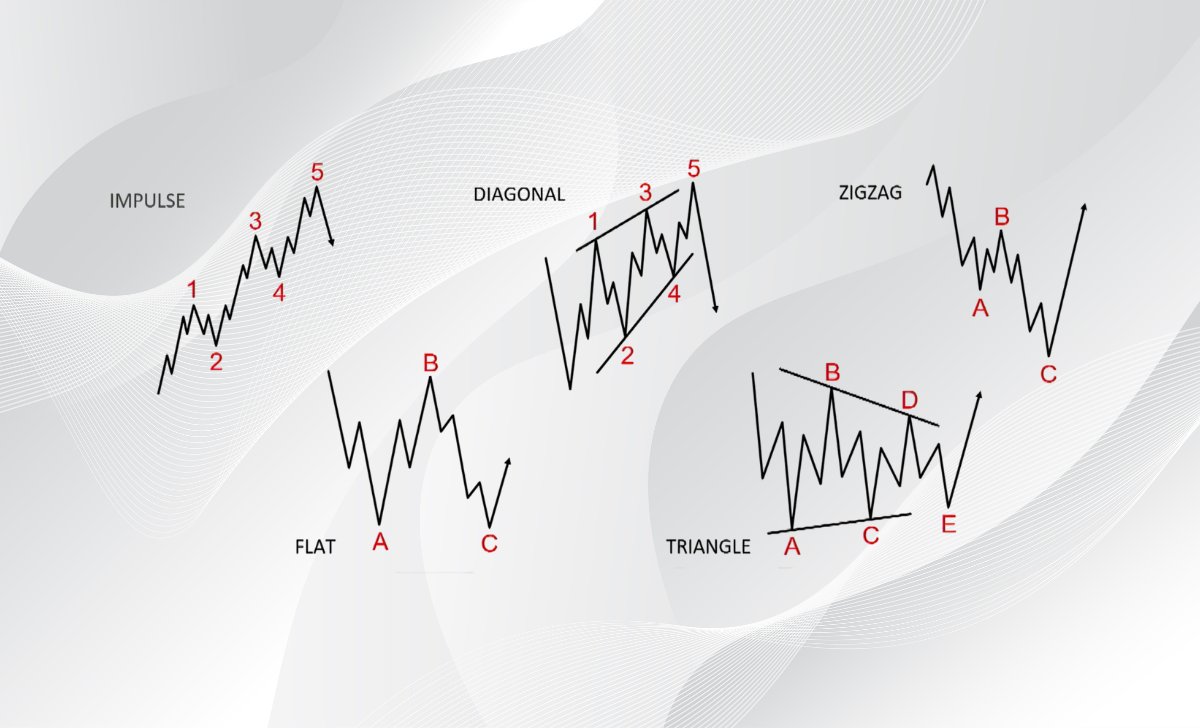
Impulse Wave patterns
- Extension Wave: One of Waves 1, 3, or 5 may extend, creating additional smaller waves, with Wave 3 typically being the longest. If Wave 3 extends once, the pattern consists of nine waves; if extended twice, the total becomes thirteen waves. Waves 1 and 5 generally maintain standard structures and tend to balance each other.
- Diagonal Triangle: Formed by connecting wave highs and lows, with two main types: Leading Diagonal (5-3-5-3-5, appearing in Wave 1 or A) and Ending Diagonal (3-3-3-3-3, appearing in Wave 5 or C). In this pattern, Waves 1, 3, and 5 are often zigzag formations, while Wave 3 is never the shortest.
- Failed 5th: Although following the impulse wave structure, Wave 5 fails to surpass the peak of Wave 3 or barely exceeds it. The other waves maintain standard formations, but this indicates a potential market reversal.
Complex Corrective patterns
Corrective waves do not always follow a simple A-B-C formation but can transform into different patterns:
- Zigzag Wave: This follows a 5-3-5 structure and often appears in Wave 2 of the primary cycle. If Wave 2 tends to move sideways, a Zigzag may appear in Wave 4, following the Alternation Principle.
- Flat Wave: This follows a 3-3-5 structure and consists of three main types: Expanded Flat, Regular Flat, and Running Flat. Flat waves often appear in Wave 2, Wave 4, or during corrective A-B-C cycles.
- Triangle Wave: This follows a 3-3-3-3-3 structure and commonly forms in Wave 4 or within A-B-C corrective sequences. This pattern reflects market accumulation and hesitation before a new movement emerges.
How to apply Elliott Wave to trading

To successfully apply Elliott Wave, investors need to accurately identify patterns and adhere to the following principles:
- Accurate wave counting: Counting waves correctly is crucial but requires practice. Master the fundamental rules of Elliott Wave and practice regularly to improve accuracy.
- Analyze multiple timeframes: Do not only observe Elliott Waves in the short term; consider the overall trend on longer timeframes such as weekly, monthly, or quarterly. This helps determine which phase of the wave cycle the market is in.
- Use Fibonacci for price targets: Elliott Wave closely correlates with Fibonacci sequences. Fibonacci ratios like 38.2%, 50%, and 61.8% are often used to determine corrective wave retracement levels relative to impulse waves. These are key zones where investors can find optimal reversal points to trade with the main trend.
- Wait for volume confirmation: Wave 3 often presents a significant trading opportunity, but patience is needed to avoid unexpected fluctuations. Wait for a clear increase in trading volume before making decisions, as this is a crucial factor in trend confirmation.
Common mistakes when using Elliott Wave
Although Elliott Wave is a powerful tool in technical analysis, misapplication can lead to unnecessary risks. Here are some common mistakes to avoid:
- Incorrect wave counting: Misidentifying wave structures can lead to inaccurate trading decisions, increasing risk.
- Overusing Elliott Wave: The market does not always follow clear wave patterns, so forcing the application in all situations can be misleading.
- Ignoring other factors: Relying solely on Elliott Wave without integrating other technical indicators may reduce analysis accuracy.
- Poor trading psychology: Lack of patience or emotional decision-making instead of following analytical principles can lead to losses.
Elliott Wave is a powerful tool that helps investors analyze trends and make more accurate trading decisions. Hopefully, this article has provided valuable insights to help you effectively apply this wave theory in practice!

As a Trading Coach with over 7 years of experience, I have guided both novice and experienced traders in mastering technical analysis and developing effective trading strategies. My personalized coaching approach has empowered many to enhance their skills and achieve consistent success in the forex market.
Email: [email protected]