Ichimoku is a powerful technical analysis tool that enables traders to visually identify trends, support, and resistance levels. It not only provides trading signals but also helps assess trend strength, allowing for optimized investment strategies.
In this article, Forex Bit will guide you through the definition, key components, usage and common mistakes to avoid effective trading!
What is Ichimoku?
Ichimoku Kinko Hyo, commonly referred to as Ichimoku, is a trading system developed by Goichi Hosoda, a Japanese financial journalist, in the 1930s. The goal of this indicator is to provide a comprehensive view of market trends at a glance.
Its name translates to “One Glance Equilibrium Chart”, and what sets Ichimoku apart from other indicators is its ability to present multiple pieces of information on a single chart. This helps traders effectively assess trends, momentum, and support/resistance levels.
Key Components of the Ichimoku Indicator
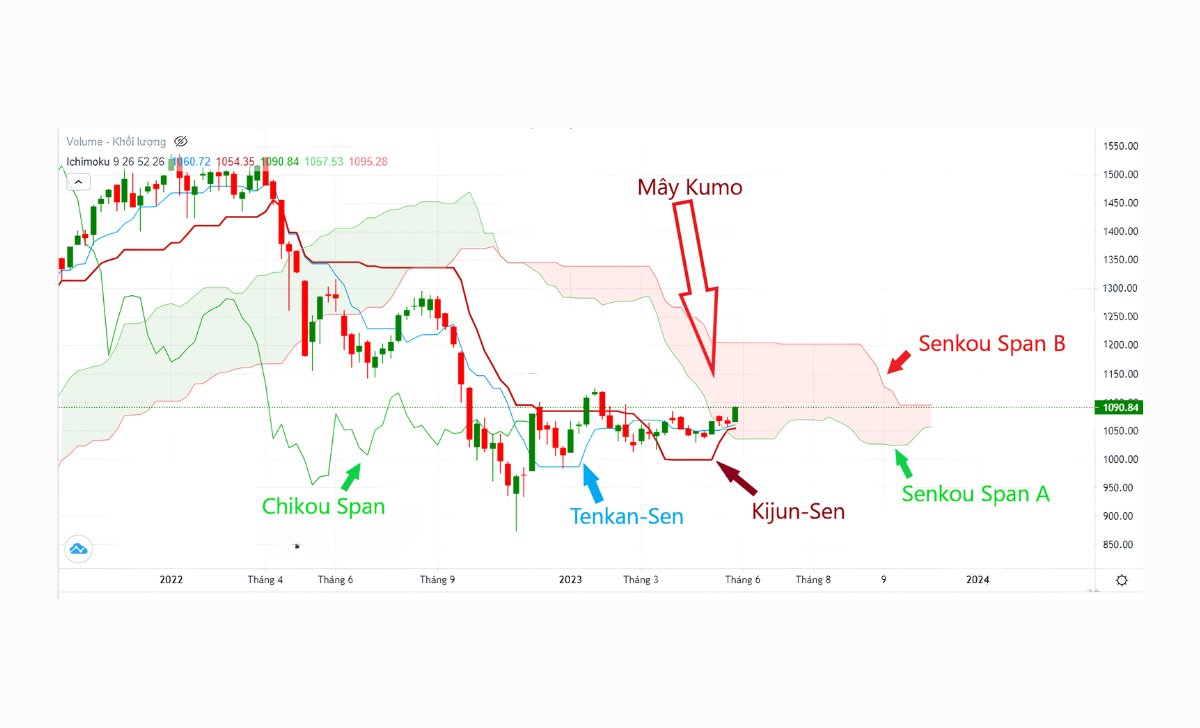
The Ichimoku indicator consists of five moving average lines, each playing a crucial role in price analysis:
- Tenkan-sen (Conversion Line): Calculated as the average of the highest high and lowest low over the past 9 periods. This line reflects short-term price trends.
- Kijun-sen (Base Line): Derived from the average of the highest high and lowest low over the past 26 periods. It serves as a medium-term trend indicator and helps identify key support and resistance levels.
- Chikou Span (Lagging Span): Represents the current closing price plotted 26 periods back. This line helps confirm trends and identify potential reversals.
- Senkou Span A: Calculated as the average of Tenkan-sen and Kijun-sen, then projected forward 26 periods.
- Senkou Span B: Determined by averaging the highest high and lowest low over the past 52 periods and plotting it 26 periods forward.
The two lines Senkou Span A and Senkou Span B form a shaded area known as the Kumo (Ichimoku Cloud):
- When Senkou Span A is above Senkou Span B, the cloud appears green, indicating an uptrend.
- Conversely, when Senkou Span B is above Senkou Span A, the cloud turns red, signaling a downtrend.
How to Use Ichimoku in Trading

The Ichimoku indicator provides multiple signals to help investors identify trends and find optimal entry points. Below are some common Ichimoku trading strategies:
Trading Based on the Crossover of Tenkan-sen and Kijun-sen
The crossover between Tenkan-sen (Conversion Line) and Kijun-sen (Base Line) is a key signal for determining entry points.
- BUY Signal: When Tenkan-sen crosses above Kijun-sen, with the crossover occurring below the Kumo (Ichimoku Cloud).
- SELL Signal: When Tenkan-sen crosses below Kijun-sen, with the crossover occurring above the Kumo.
Entry Strategy:
- Enter a trade as soon as a confirmation candlestick appears (green for BUY, red for SELL).
- Set stop-loss below the crossover area or the nearest support (for BUY) and above the crossover area or the nearest resistance (for SELL).
- Take profit based on an appropriate risk-to-reward (R:R) ratio aligned with your trading strategy.
Trading Based on Chikou Span Crossing the Price Line
The Chikou Span (Lagging Span) compares the current price to 26 periods ago to confirm the trend.
- BUY Signal: When Chikou Span crosses above the price line from below.
- SELL Signal: When Chikou Span crosses below the price line from above.
Entry Strategy:
- Enter a trade near the crossover area when a confirmation candlestick appears.
- Set stop-loss below the nearest support (for BUY) or above the nearest resistance (for SELL).
- Take profit based on expected profit targets.
Trading Based on the Crossover of Senkou Span A and Senkou Span B
The two lines, Senkou Span A and Senkou Span B, form the Kumo (Ichimoku Cloud), which helps identify market trends.
- BUY Signal: When Senkou Span A crosses above Senkou Span B, causing the Kumo to change from red to green.
- SELL Signal: When Senkou Span A crosses below Senkou Span B, causing the Kumo to shift from green to red.
Entry Strategy:
- Enter a trade when a confirmation candlestick appears, signaling the color change of the Kumo.
- Set stop-loss below the nearest support (for BUY) or above the nearest resistance (for SELL).
- Take profit based on the desired profit target.
Trading When Price Breaks Through the Kumo (Breakout Strategy)
This is a strong trend-following strategy, often yielding high profits but also carrying higher risk.
- BUY Signal: When price breaks through the Kumo from below and closes above the cloud.
- SELL Signal: When price breaks through the Kumo from above and closes below the cloud.
Entry Strategy:
- Enter a trade immediately after the price breaks the Kumo, or wait for a retest of the cloud before entering.
- Set stop-loss below the Kumo (for BUY) or above the Kumo (for SELL).
- Take profit using Fibonacci Extension levels or key support/resistance zones.
Advanced Trading: Combining Multiple Ichimoku Signals
Traders can combine multiple Ichimoku signals to enhance accuracy in their trades.
BUY Setup:
- The main trend is upward.
- Tenkan-sen crosses above Kijun-sen from below.
- Senkou Span A crosses above Senkou Span B, causing the Kumo to change from red to green.
- Chikou Span is above the price line, and the farther it is from the price, the stronger the trend.
Execution:
- Entry point: A green candlestick at the confluence of signals.
- Stop-loss: Below the nearest support level, ensuring risk does not exceed 5-8% of the account.
- Take profit: Based on Fibonacci Extension or an appropriate risk-to-reward (R:R) ratio.
SELL Setup:
- The main trend is downward.
- Tenkan-sen crosses below Kijun-sen from above.
- Senkou Span A crosses below Senkou Span B, causing the Kumo to change from green to red.
- Chikou Span is below the price line.
Execution:
- Entry point: A red candlestick below the Kumo Cloud.
- Stop-loss: Above the nearest resistance level, ensuring a 5-8% stop-loss ratio.
- Take profit: Based on Fibonacci Extension, targeting levels 61.8% to 168%.
Common Mistakes to Avoid When Using Ichimoku

Although Ichimoku is a highly effective trading tool, making the following mistakes can lead to poor decisions and increased risk.
- Using Ichimoku Without Checking the Larger Trend: Many traders rely only on lower timeframes for analysis without considering higher timeframes. This can result in trading against the main trend, increasing the risk of losses.
- Entering Trades Without Kumo Cloud Confirmation: Some traders rush into trades when Tenkan-sen crosses Kijun-sen, without checking if the price has confirmed the trend through the Kumo cloud. This often leads to false signals and failed trades.
- Not Combining Ichimoku With Other Indicators: While Ichimoku is a powerful system, it is not an all-in-one solution. Incorporating additional indicators like RSI Indicator or MACD Indicator can improve accuracy and optimize trading strategies.
Ichimoku is a powerful tool that helps traders identify trends and optimize trading strategies when used correctly. Start applying this indicator in real trading, and combine it with other tools to enhance effectiveness and gain more confidence in your investment decisions!

As a Trading Coach with over 7 years of experience, I have guided both novice and experienced traders in mastering technical analysis and developing effective trading strategies. My personalized coaching approach has empowered many to enhance their skills and achieve consistent success in the forex market.
Email: [email protected]