The Pivot Point is a technical analysis tool used by traders to identify potential support and resistance levels in the market. It helps traders make informed decisions about market trends and potential price reversals.
The Pivot Point is a key indicator that traders use to determine critical price levels for market entry and exit. To understand how to effectively use this tool in your trading strategy, keep reading this article from Forex Bit.
What is a Pivot Point?
A Pivot Point is a central price level calculated from the high, low, and close of the previous trading session. This level is important because it gives a potential trend indication for the market in the next trading session. If the price is trading above the Pivot Point, the market may be in a bullish trend, while a price below the Pivot Point could signal a bearish trend.
How to Calculate Pivot Points

To calculate Pivot Points, you use three main price points from the previous trading session: the high, low, and close. Below are the formulas to calculate the Pivot Point and support/resistance levels:
- Pivot Point (PP): The central level is calculated as the average of the high, low, and close prices from the previous session: PP = (High + Low + Close) / 3
- Support Levels:
- S1: First support level: S1 = (2 × PP) – High
- S2: Second support level: S2 = PP – (High – Low)
- S3: Third support level: S3 = Low – 2 × (High – PP)
- Resistance Levels:
- R1: First resistance level: R1 = (2 × PP) – Low
- R2: Second resistance level: R2 = PP + (High – Low)
- R3: Third resistance level: R3 = High + 2 × (PP – Low)
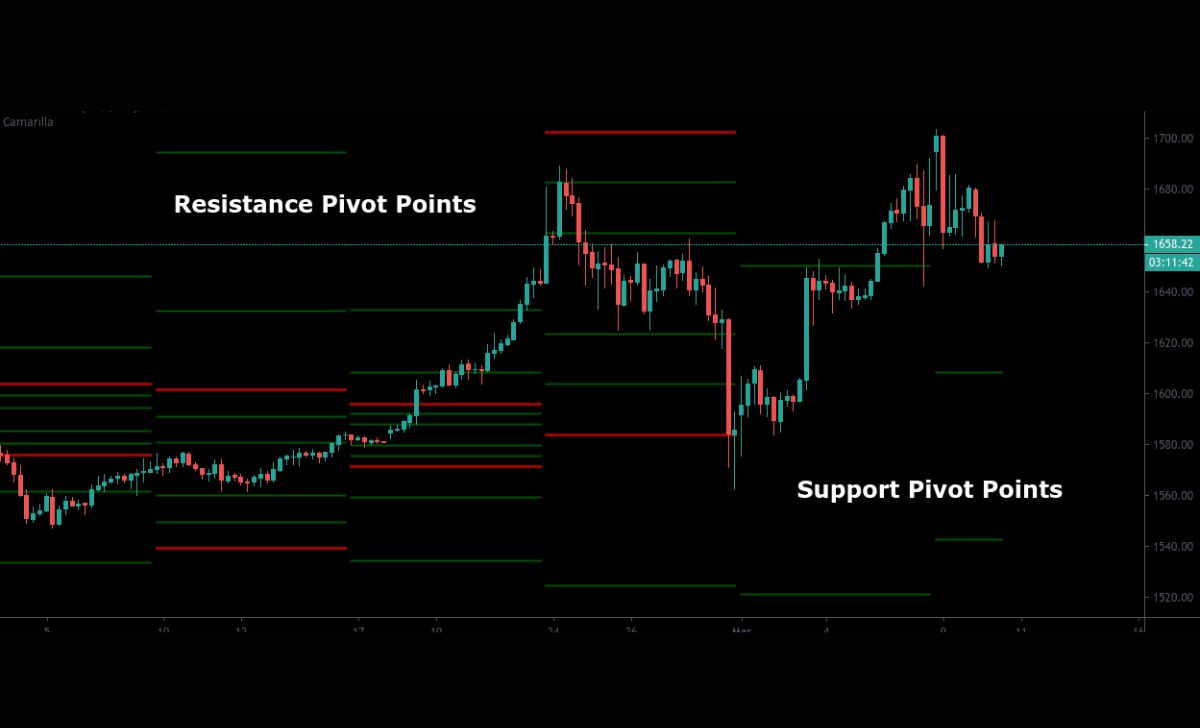
Pivot Point Indicator
To use Pivot Points efficiently, many traders rely on the Pivot Point Indicator available on trading platforms such as MetaTrader 4 (MT4) or MetaTrader 5 (MT5). The indicator automatically calculates and plots the Pivot Points, support, and resistance levels on your chart, making it easier for you to identify potential turning points in the market. These levels act as guideposts, helping traders decide when to enter or exit trades.
How to Use Pivot Points in Forex Trading
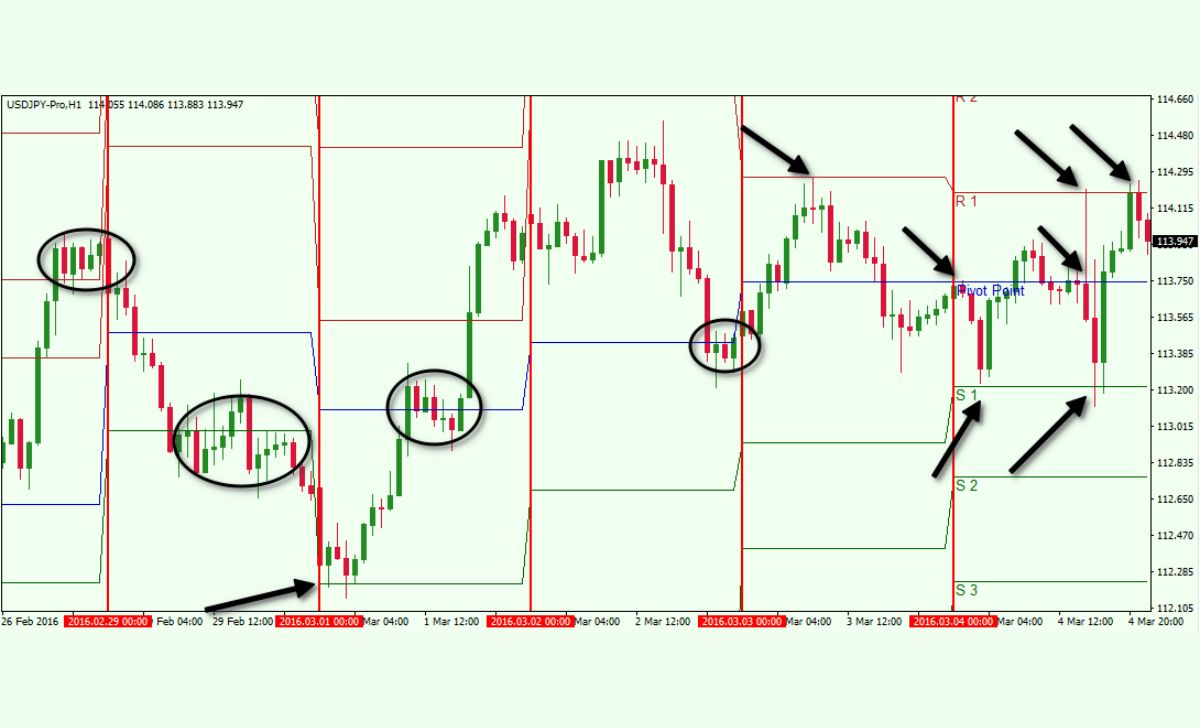
In Forex trading, Pivot Point are most commonly used to determine market trends and potential price reversals. Here’s how to apply Pivot Points in your Forex trading strategy:
- Bullish Signal: If the price is trading above the Pivot Point, it suggests the market may be in an uptrend. In this case, traders typically look for buying opportunities around the support levels (S1, S2, or S3), with the expectation that the price will continue to rise.
- Bearish Signal: If the price is trading below the Pivot Point, the market may be in a downtrend. In this scenario, traders look for selling opportunities around the resistance levels (R1, R2, or R3), anticipating further downward movement.
- Range-Bound Market: If the price is hovering around the Pivot Point and moving within the support and resistance levels, it indicates a sideways market. Traders can take advantage of this by buying near support levels and selling near resistance levels.
Benefits of Using Pivot Points

- Simplicity: Pivot Points are easy to calculate and implement, even for beginners.
- Effective Trend Identification: Pivot Points help identify whether the market is in an uptrend or downtrend, allowing traders to adjust their strategies accordingly.
- Predicting Reversals: Pivot Points can help predict potential reversal points, giving traders a clear entry or exit point.
- Widely Used: Pivot Points are used by a large number of professional traders, so they are often self-fulfilling prophecies — meaning price tends to react at these levels.
Pivot Point Trading Strategies
- Breakout Strategy: When the price breaks above a resistance level (R1, R2, or R3) or below a support level (S1, S2, or S3), it may indicate a strong trend continuation. Traders can enter trades when these breakout levels are breached.
- Range Trading Strategy: If the market is range-bound, traders can buy at support levels and sell at resistance levels. This strategy works well in sideways markets when the price fluctuates between support and resistance.
- Confluence Strategy: Combine Pivot Points with other indicators, such as Moving Averages or RSI, to increase the accuracy of your trading signals. When Pivot Points align with other technical indicators, it strengthens the reliability of the trade setup.
Incorporating Pivot Points into your trading strategy can provide clear insights into market trends and potential price movements. By using this powerful tool, you can make more informed and effective trading decisions. To further enhance your trading skills, learn Forex at Forex Bit and take your trading to the next level.

As a Financial Analyst with over 5 years of experience, I focus on analyzing financial data to provide actionable insights and recommendations for investment strategies. My expertise in forecasting and financial modeling has helped businesses optimize their financial performance and mitigate risks.
Email: [email protected]