The Bat Pattern is a powerful Harmonic pattern that helps traders identify potential reversal points. When applied correctly, this pattern can yield high profits and minimize trading risks.
So, what exactly is the Bat Pattern? How can traders recognize and trade it effectively? Let’s explore the details with Forex Bit in this article.
What is the Bat Pattern?
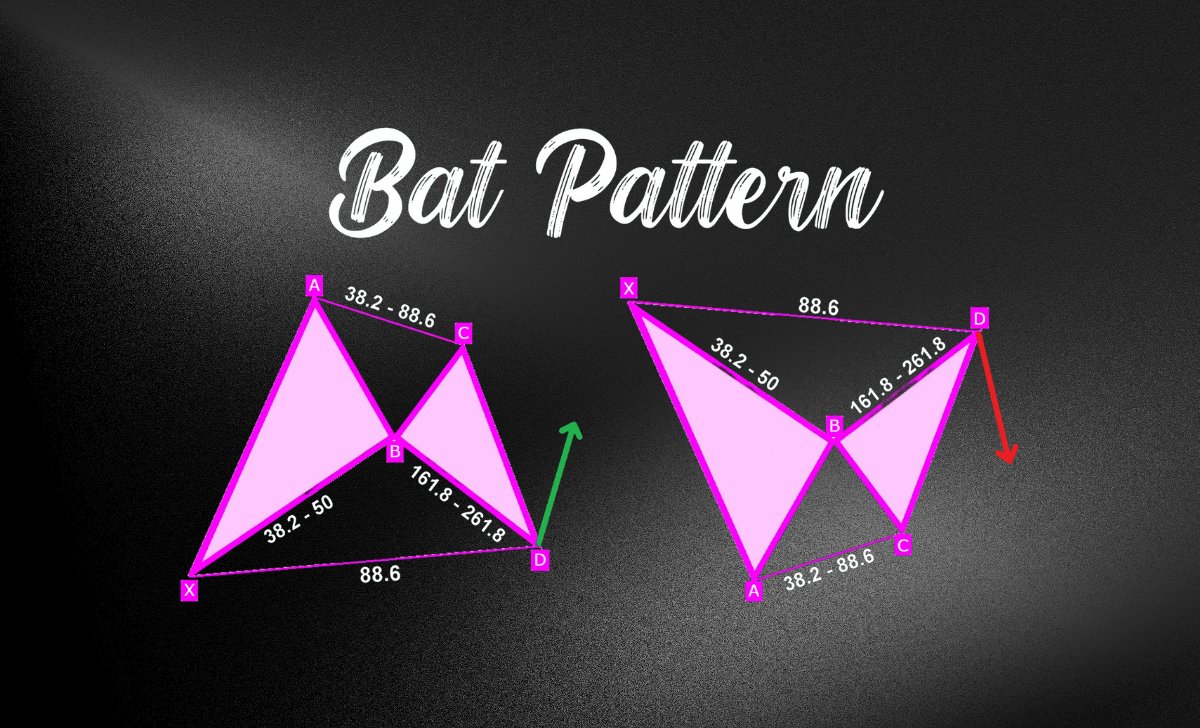
The Bat Pattern is a Harmonic Pattern developed by Scott Carney in 2001. It represents a price correction before the market continues its primary trend. A key characteristic of this pattern is that point D is located at the 88.6% Fibonacci retracement level of XA, allowing traders to identify potential entry zones with high accuracy.
The Bat Pattern is based on Fibonacci Retracement and Fibonacci Extension principles, helping traders pinpoint confluence zones where price may reverse. Once this pattern forms, traders can take advantage of it by placing buy orders (Bullish Bat) or sell orders (Bearish Bat), depending on market trends.
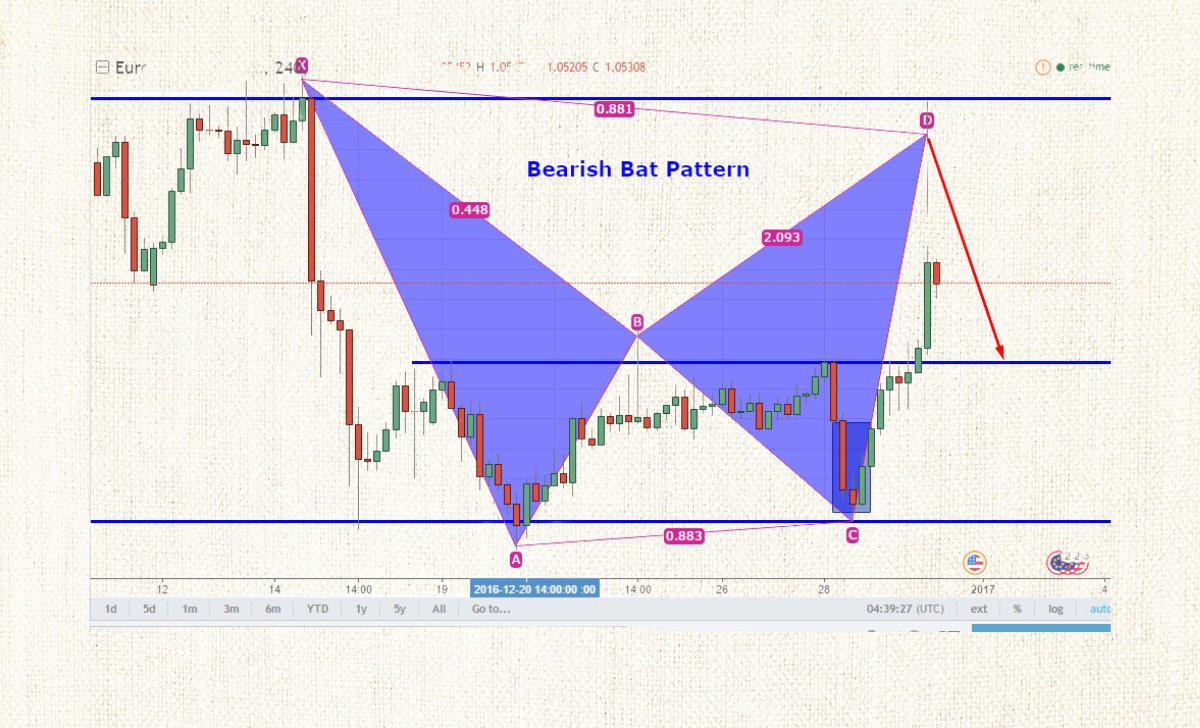
Key characteristics of the Bat Pattern
The Bat Pattern consists of five key points: X, A, B, C, D, with specific Fibonacci ratios as follows:
- XA: The initial price movement.
- AB: A retracement of XA, ranging from 38.2% to 50% of XA.
- BC: A corrective move within 38.2% to 88.6% of AB.
- CD: The final and most crucial leg, extending 161.8% to 261.8% of BC.
- D: The 88.6% Fibonacci retracement of XA – the primary entry point for this pattern.
Types of Bat Patterns
Bullish Bat Pattern
- Appears in a downtrend.
- Point D forms in a strong support zone, signaling a potential upward reversal.
- Traders can place a BUY order at point D and set a Stop-Loss below point X to minimize risk.
Bearish Bat Pattern
- Appears in an uptrend.
- Point D forms in a key resistance zone, signaling a potential downward reversal.
- Traders can place a SELL order at point D and set a Stop-Loss above point X to protect their account.
How to Trade the Bat Pattern

When identifying a Bat Pattern or Gartley Pattern, traders can follow these steps to execute trades:
Step 1: Identify the pattern on the chart
- Use Fibonacci Retracement tools to verify the XA, AB, BC, and CD ratios.
- Check for the pattern on H1, H4 or daily timeframes to improve accuracy.
Step 2: Place an order at point D
- Bullish Bat: Enter a BUY order when the price reaches point D.
- Bearish Bat: Enter a SELL order when the price reaches point D.
Step 3: Set Stop-Loss and Take-Profit levels
- Stop-Loss:
- Below point X (for Bullish Bat).
- Above point X (for Bearish Bat).
- Take-Profit Targets:
- TP1: 38.2% Fibonacci retracement of CD.
- TP2: 61.8% Fibonacci retracement of CD.
Step 4: Use additional technical indicators
- RSI or Stochastic: Check for overbought/oversold conditions to confirm signals.
- Volume: Analyze whether volume weakens or strengthens as price approaches point D.
Example of Trading with the Bat Pattern
Assume you are trading the EUR/USD pair on an H4 chart and identifying a Bullish Bat Pattern with the following parameters:
- XA: A strong downtrend.
- AB: Retraces 50% of XA.
- BC: Retraces 50% of AB.
- CD: Declines to 88.6% of XA (point D).
Trading Strategy:
- Enter a BUY order at point D.
- Set Stop-Loss below point X by 20 pips.
- Take-Profit targets at 38.2% and 61.8% Fibonacci levels of CD.
Result:
The price reverses in the expected direction, yielding a favorable Risk/Reward ratio of 1:3.
Common mistakes to avoid when trading the Bat Pattern

Although the Bat Pattern is highly effective, incorrect application can lead to unwanted risks. Here are some common mistakes to avoid:
- Incorrectly identifying point D: Many traders misdraw the pattern, especially by placing point D incorrectly instead of at the 88.6% level of XA. Always use Fibonacci Retracement to ensure the pattern’s validity.
- Failing to check confirmation signals: Price reaching point D does not guarantee an immediate reversal. It is essential to combine signals from RSI, MACD, or reversal candlestick patterns before entering a trade.
- Ignoring the overall trend: Trading the Bat Pattern against the primary trend increases the risk of hitting Stop-Loss. Always check higher timeframes (H4 or D1) before executing a trade.
- Placing Stop-Loss at the Wrong Level: A Stop-Loss set too close can be easily triggered, while one set too far increases risk exposure. Place a Stop-Loss at a reasonable level below X (for Bullish Bat) or above X (for Bearish Bat) to protect your account.
- Entering trades before the pattern completes: Rushing into a trade before price fully reaches point D can reduce the pattern’s effectiveness. Be patient and wait for the pattern to complete before entering a trade.
- Poor risk management and trading psychology: Placing excessively large orders can lead to loss of control if the trade fails. Always follow the 1-2% risk per trade rule to protect your capital.
The Bat Pattern is an effective trading tool that helps traders identify reversals with high accuracy. Hopefully, this article has provided you with a clear understanding of its characteristics, trading strategies, and how to avoid common mistakes when using this pattern.

As a Trading Coach with over 7 years of experience, I have guided both novice and experienced traders in mastering technical analysis and developing effective trading strategies. My personalized coaching approach has empowered many to enhance their skills and achieve consistent success in the forex market.
Email: [email protected]