Harmonic Pattern is one of the important technical analysis tools that help investors identify potential reversal points in the financial markets. By utilizing Fibonacci ratios, these patterns can accurately forecast price trends, thus helping traders optimize their trading strategies.
In this article, Forex Bit will provide you with detailed information about Harmonic Patterns, their common types, and how to trade effectively using this model!
What is a Harmonic Pattern?
A Harmonic Pattern is a group of price patterns determined by Fibonacci ratios, helping investors predict reversal points in the financial markets. These patterns were developed by Harold M. Gartley and later improved by many other technical analysts.
Unlike traditional price patterns such as Head and Shoulders or Double Top/Bottom, Harmonic Patterns have a clear geometric structure and follow specific Fibonacci ratios such as 0.618, 0.786, 1.272, and 1.618. This helps traders accurately identify entry points, stop losses, and take-profit levels.
Structure of a Harmonic Pattern
A Harmonic Pattern typically consists of 4 or 5 main points: X, A, B, C, D, forming distinctive geometric patterns on a price chart.
- Point X-A is the initial price movement.
- Point B-C represents the Fibonacci retracement levels.
- Point D is the potential reversal area.
Traders use Fibonacci Retracement and Fibonacci Extension to measure the distances between the points and determine whether the pattern is valid.
Common Harmonic Patterns
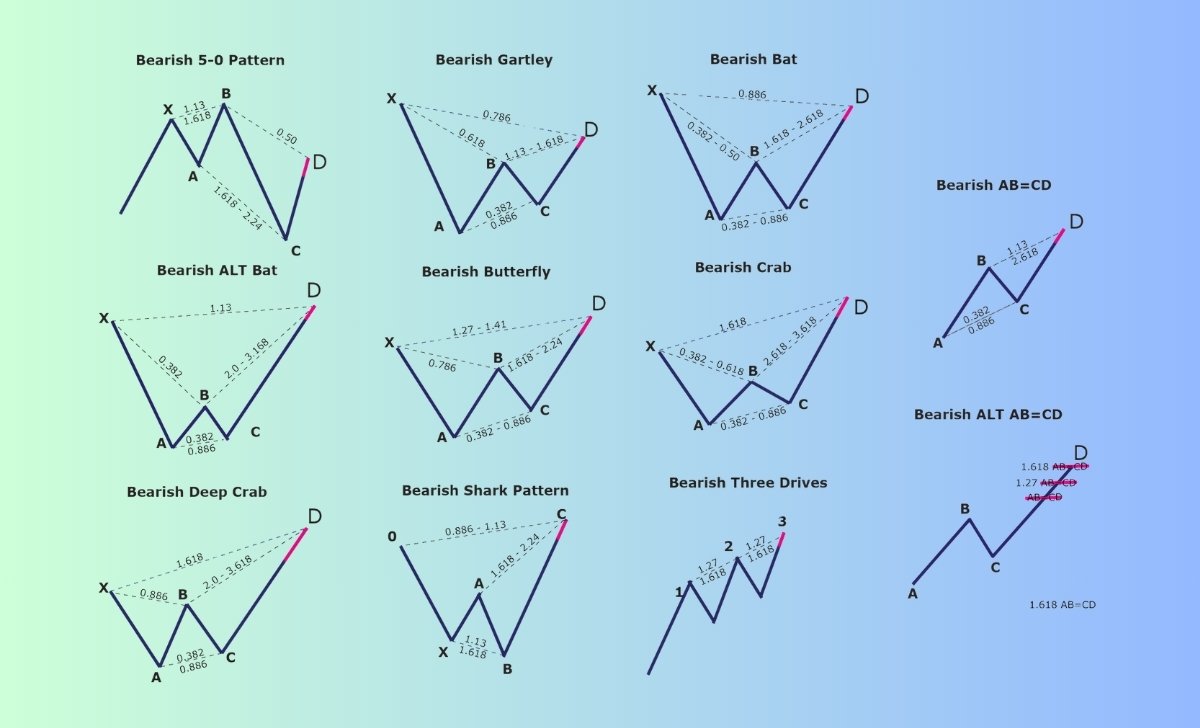
In financial trading, Harmonic Patterns help traders identify potential reversal points by using Fibonacci ratios. Below are the most common Harmonic Patterns that investors often apply.
Gartley Pattern
The Gartley Pattern is one of the oldest Harmonic Patterns, developed by Harold M. Gartley. This pattern consists of four segments: XA, AB, BC, CD, where:
- Point B must retrace 61.8% of XA.
- Point D ends at 78.6% of XA, creating a Potential Reversal Zone (PRZ).
How to Trade:
- Point D is the potential reversal area and an ideal place to open a position.
- Stop-loss is often placed at point X to minimize risk.
- The take-profit target can be point C or further, depending on market trends.
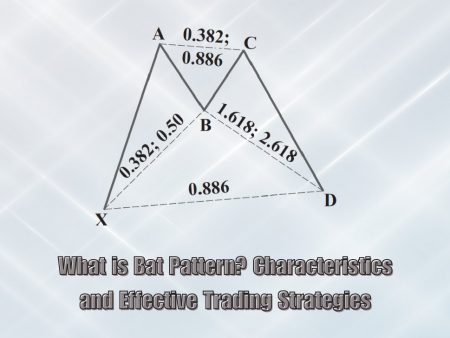
Bat Pattern
The Bat Pattern was introduced by Scott Carney in 2001 and has many similarities with the Gartley Pattern. However, the main difference lies in the retracement of point B.
- Point B retraces 50% of XA.
- Point D reaches 88.6% of XA, marking the reversal area.
- CD extends from 1.618 to 2.618 of BC.
How to Trade:
- Point D is the ideal entry point.
- Place stop-loss just below point X.
- Take profit at the Fibonacci extension of CD.
ABCD Pattern
The ABCD Pattern (or AB=CD) is the simplest Harmonic Pattern, making it easier for traders to identify reversal points. It consists of three main movements:
- AB: The initial trend.
- BC: The retracement phase, typically retracing 61.8% of AB.
- CD: The next trend, with a length equivalent to AB and similar movement duration.
How to Trade:
- Traders can enter near point C (PRZ) or wait for the pattern to complete at point D.
- Stop-loss is placed just below point C or D, depending on the trading strategy.
Butterfly Pattern
The Butterfly Pattern, developed by Bryce Gilmore, helps identify strong reversal zones. A key feature of this pattern is that point D extends far beyond point X.
- Point B retraces 78.6% of XA.
- Point D extends from 1.272 to 1.618 of XA.
How to Trade:
- Enter when the price reaches point D.
- Place stop-loss further to avoid being stopped out.
- The profit target is usually set at point C or the Fibonacci extension.
Crab Pattern
The Crab Pattern was also developed by Scott Carney and is the pattern with the largest range of price fluctuations in the Harmonic group.
- Point B retraces 38.2% – 61.8% of XA.
- Point D extends at least 1.618 of XA, potentially up to 3.618.
How to Trade:
- Enter at point D when the price shows signs of reversal.
- Place a wider stop-loss due to high volatility.
- Take profit in parts based on the Fibonacci extension.
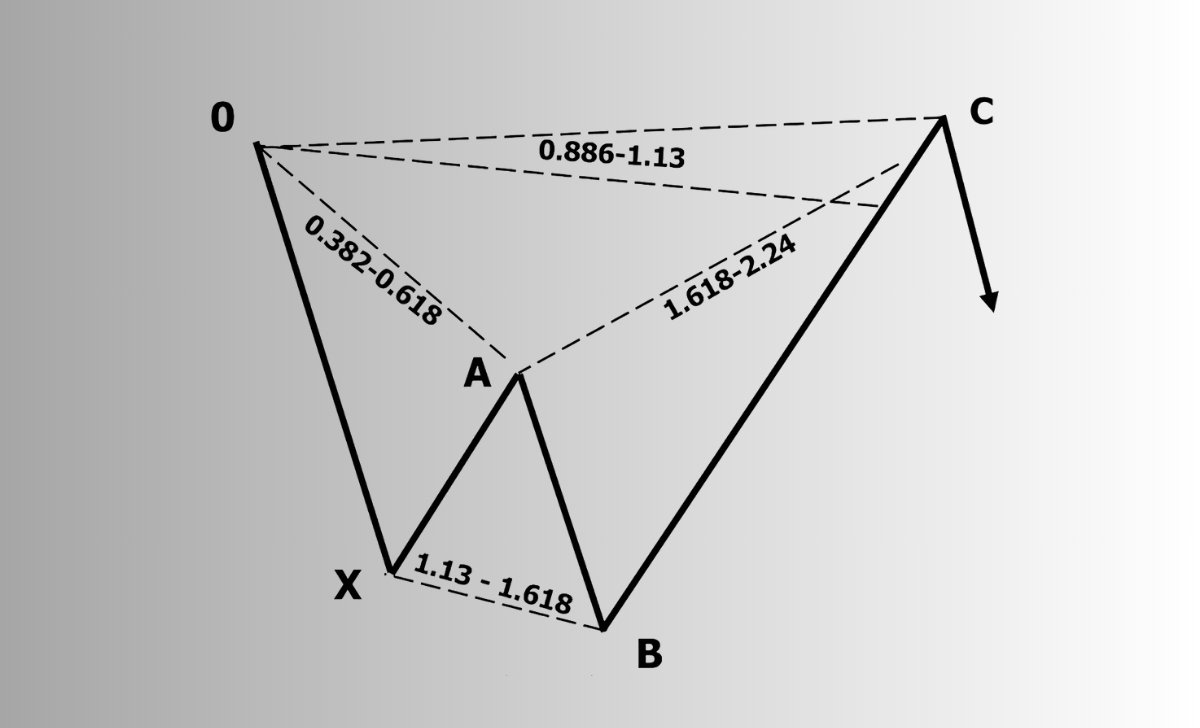
Shark Pattern
The Shark Pattern is another invention by Scott Carney, consisting of five points and special Fibonacci ratios.
- Point B retraces 1.13 to 1.618 of XA.
- Point C extends 113% of OX.
- Point D lies at the 50% Fibonacci retracement of BC.
How to Trade:
- Point C is the best entry point.
- Stop-loss can be placed near point X.
- Point D is the target price for making profit.
Advantages and limitations of Harmonic Patterns

Here are the advantages and limitations of Harmonic Patterns that traders need to understand:
Advantages
- High accuracy signals: Harmonic Patterns help identify reversal points and stop-loss levels with great accuracy, making them a top forecasting tool for many traders.
- Frequent occurrence and easy identification: Harmonic patterns and the Marubozu Candlestick Pattern tend to repeat in multiple market cycles, helping investors systematically capture price movements.
- Based on standardized Fibonacci ratios: Applying Fibonacci ratios makes the pattern highly standardized, thus increasing reliability in analysis and trading.
- Suitable for various market conditions: Harmonic Patterns can work well in multiple timeframes and can be easily combined with other technical indicators for improved trading effectiveness.
- Helps measure price fluctuation ranges: Investors can use Harmonic Patterns to assess the intensity of price fluctuations and make informed trading decisions.
Limitations
- Complex and difficult for beginners: Harmonic Patterns require in-depth knowledge of technical analysis, especially the use of Fibonacci ratios, making them unsuitable for inexperienced traders.
- Conflict with other indicators: Sometimes, signals from Fibonacci and other technical indicators may not align with Harmonic Patterns, making it harder to identify reversal zones.
- Overlapping patterns in timeframes: Multiple Harmonic Patterns may appear on the same chart, leading to confusion in analysis and trading decisions.
- Disproportionate risk/reward ratios: Although Harmonic Patterns are highly accurate, the risk/reward (R:R) ratio is often not very attractive, which may deter some investors from using them.
Effective Harmonic Pattern trading tips

To trade effectively with Harmonic Patterns and margin trading, traders need to follow several key principles:
- Confirm the pattern before entering: Only trade once the pattern is complete to avoid false signals. Rushing into a trade can lead to inaccurate decisions and losses.
- Combine with other indicators: Use tools like RSI, MACD, or candlestick reversal patterns to confirm trading signals. This helps increase accuracy and reduce risk in market analysis.
- Set a proper stop-loss: Always have a risk management plan in place to protect your account from significant volatility. Placing stop-loss at the right level helps prevent unwanted stop-outs.
- Practice on a demo account first: Testing on a demo account allows traders to get familiar with the pattern without financial risk. It also improves analysis skills and helps build better trading strategies.
Harmonic Patterns are a powerful tool for investors to accurately identify reversal points, but they require patience and advanced technical skills. We hope that through this article, you now have a clear understanding of how to apply Harmonic Patterns effectively in your trading to achieve the best results!

As a Trading Coach with over 7 years of experience, I have guided both novice and experienced traders in mastering technical analysis and developing effective trading strategies. My personalized coaching approach has empowered many to enhance their skills and achieve consistent success in the forex market.
Email: [email protected]